 |
MET-COFEA:
A Novel Liquid Chromatography-Mass Spectrometry Data Processing Platform for Metabolite Compound Feature Extraction and Annotationn
|
|
|
||
|
| Location: Introduction | |
|
Metabolomic data analysis by LC-MS (Liquid Chromatography coupled with Mass Spectrometry) involves in thousands of chromatograph peak features arising from metabolites, fragments, isotopes, and adducts. The peaks from the same metabolite compound have the near retention time and peak shape similarity, and also the same molecular mass deduced from the observed m/z value, which can be considered as metabolite compound’s specific multi-feature, and used to elucidate the metabolite compound structure. Herein, we present a novel LC-MS data processing and analysis platform entitled as MET-COFEA(METabolite COmpound Feature Extraction and Annotation), which can be used in metabolomics study. MET-COFEA is aiming to detect and cluster the meaningful chromatograph peak features for each metabolite compound based on the retention time and peak shape criteria, and then annotate the relationship between each peak’s observed m/z value with the corresponding metabolite compound’s molecular mass. MET-COFEA has been implemented as a seamless pipeline for data analysis and suit for high-throughout metabolomics profiling. For each LC-MS data set, MET-COFEA detects the meaningful chromatographic peaks and then clusters the peaks into different groups according to retention time and peak shape criteria, and finally the peak annotation module is used to annotate the adduct/fragment peak that is associated with the same compound. Fig.1 gives the illustration of MET-COFEA workflow, at first, 5meaningful mass traces are extracted and outlined in m/z-retention time domain, then the chromatograph peaks are extracted and further grouped according to peak retention time and shape similarity, finally annotated into a peak list. The right spectrums illustrate how a mixed and noisy spectrum can be filtered/purified into a meaningful authentic compound related spectrum. The output results of MET-COFEA are the peak list tables that have been clustered and annotated into different compound groups by unique Compound_ID, by which a library based on the metabolite’s multi-features can be built. 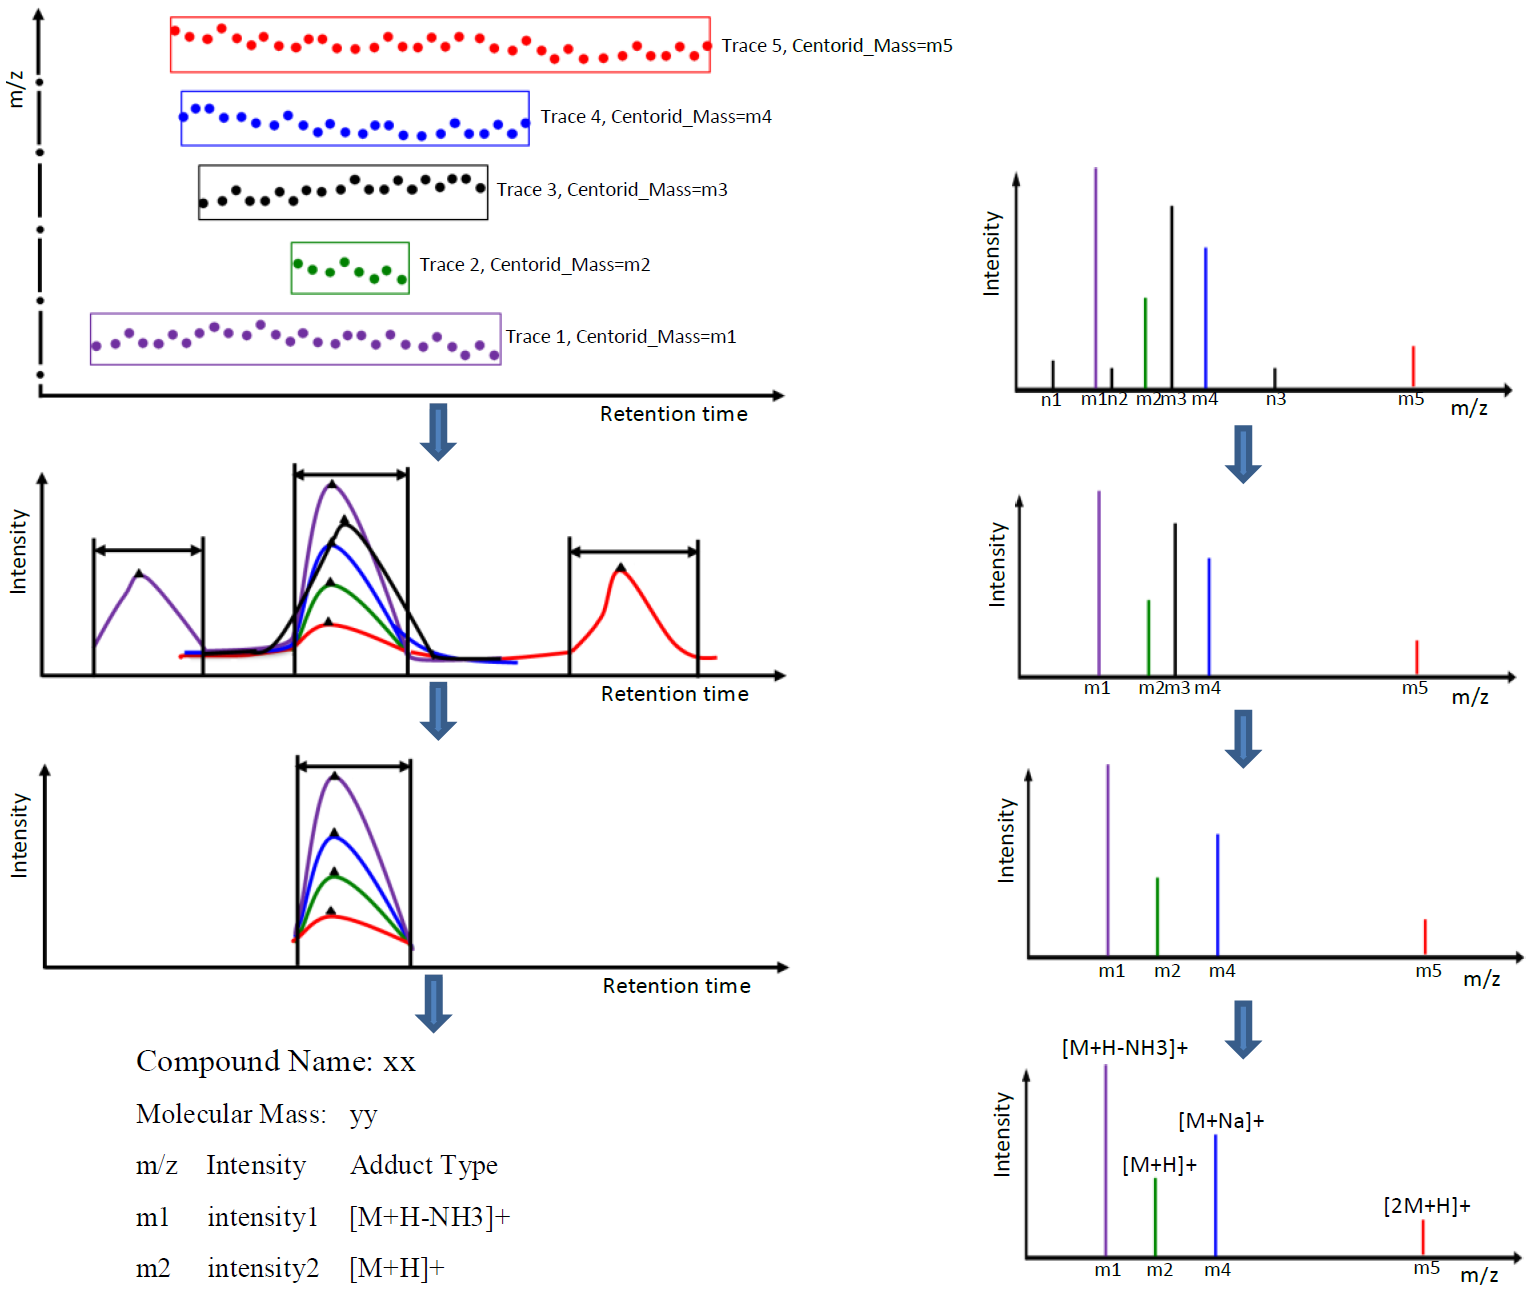 Fig. 1 Illustration of MET-COFEA workflow METCOFEA can be summarized as three integrative modules: Compound Feature Extraction, Compound Feature Annotation and Compound Alignment(see Fig.2). Compound feature extraction module aims to extract individual peaks that corresponding to compound’s fragments from each inputting LC/MS raw data. Compound feature annotation module aims to cluster/group peaks based on peak shapes, retention time, and then annotate the detected clusters/groups, and further to identify compound-associated peak clusters/groups. Compound alignment module is aiming to align the same compound based on compound-associated peak clusters/groups across different samples. The basic architecture of MET-COFEA is depicted in Fig.3. It mainly includes a core and user interface. The core of MET-COFEA(entitled as MET-COFEA Engine) mainly includes several data processing modules and several assisting modules, which is written standard C++ using Standard Template Libraries (STL). The user interface mainly includes interactive parameter configuration and visualization. Additionally, a wrapper is written in CLI/C++, which acts as a bridge between the front-end visualization and the back-end processing. All of the codes are developed and compiled in Microsoft Visual Studio Ultimate 2012. 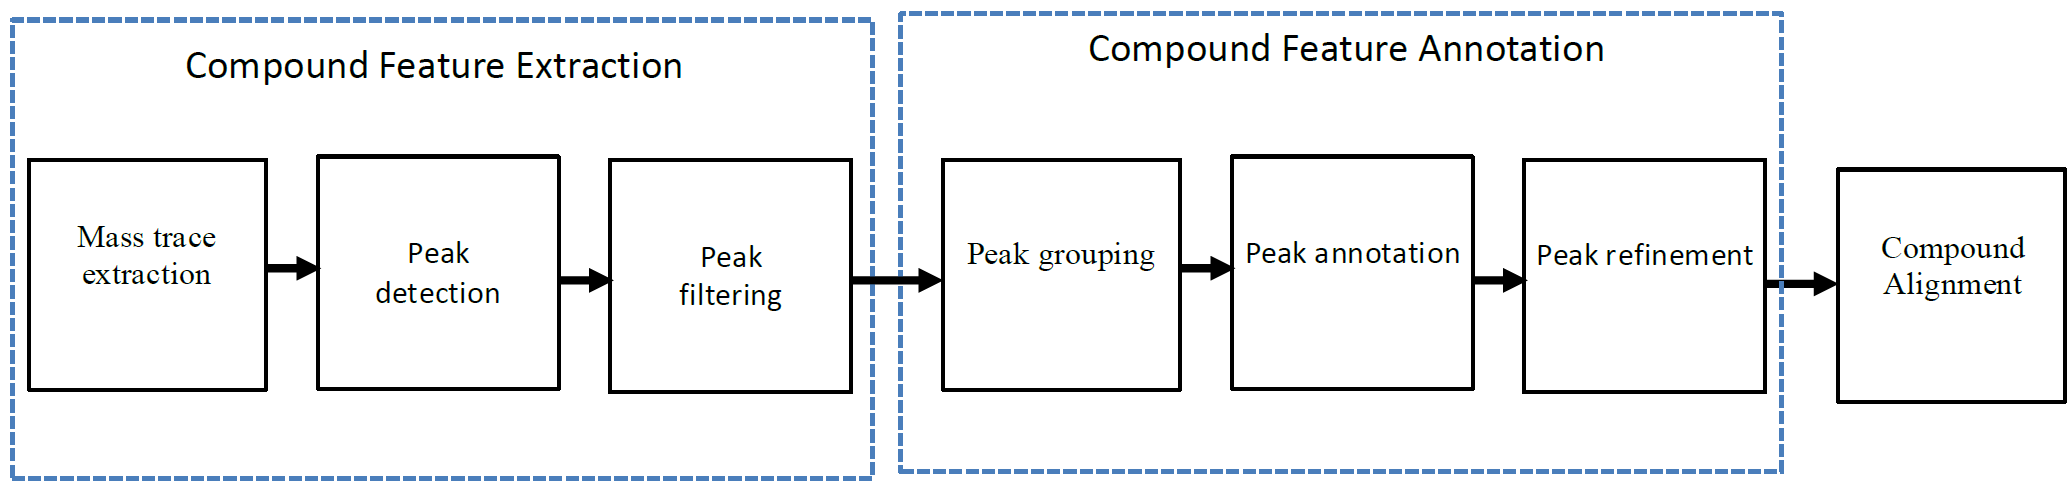 Fig. 2 Three integrative key modules in MET-COFEA 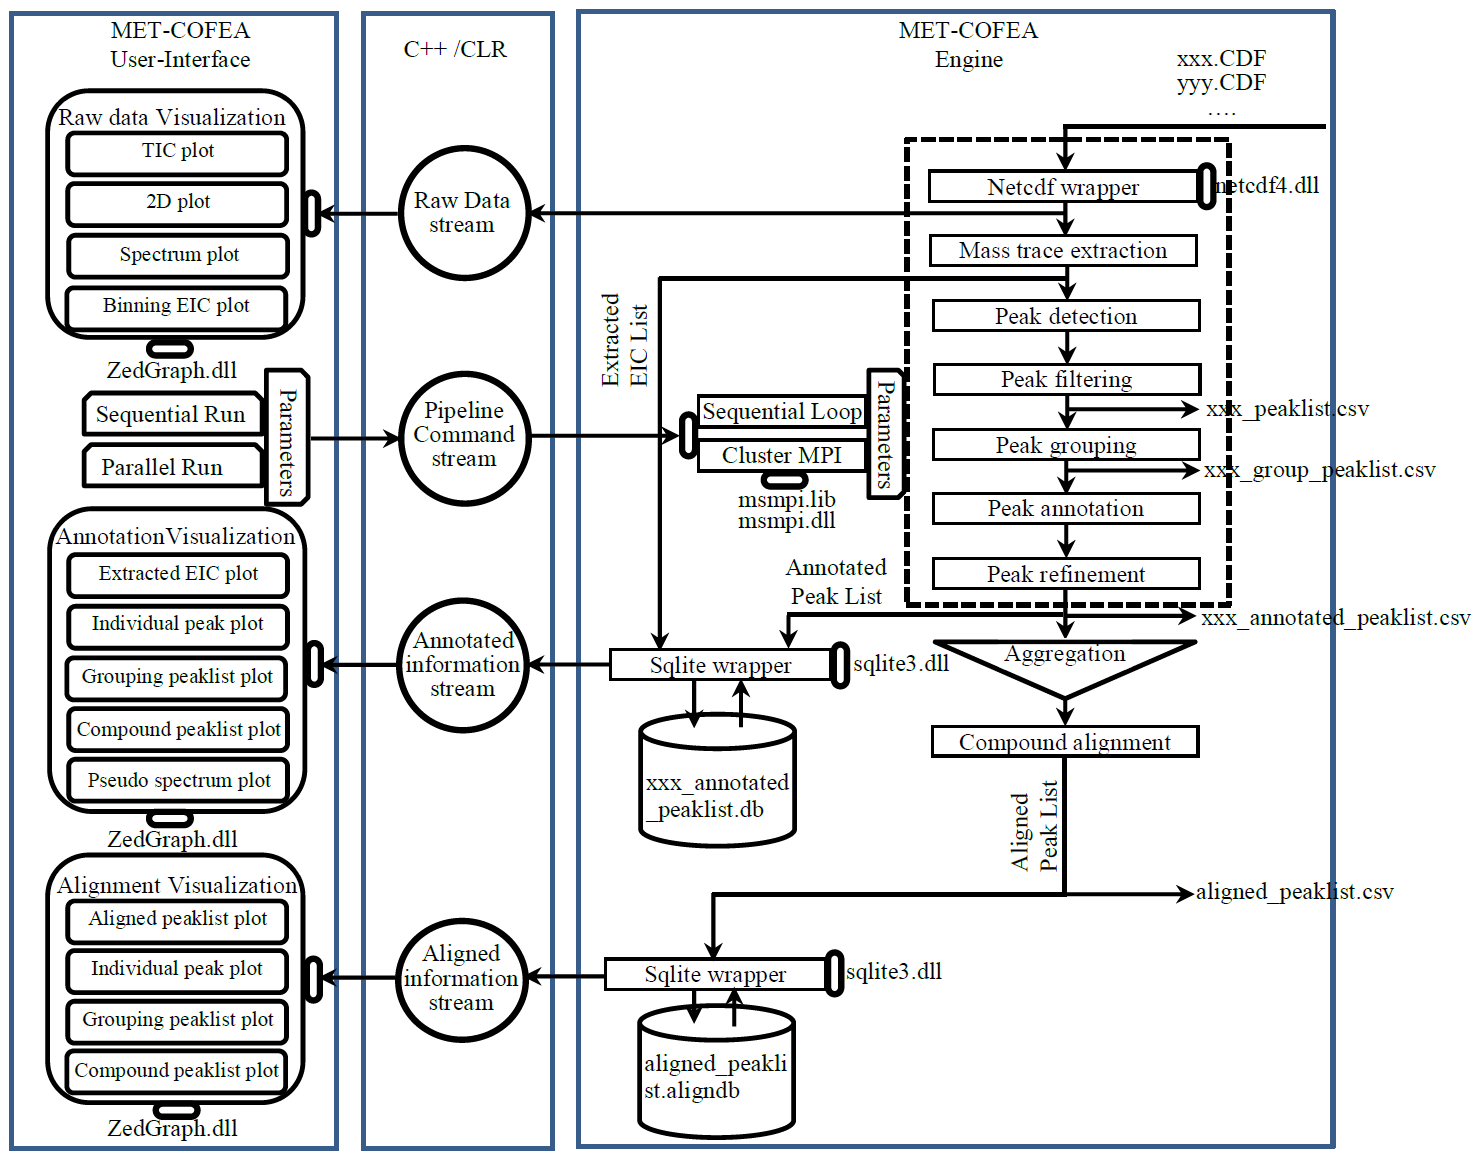 Fig. 3 Implementation architecture of MET-COFEA Using MET-COFEA, the user can visualize the selected sample (.CDF raw data) and process the loaded data samples at batch or parallel mode(Fig.4), once the parameters are configured(Fig.5) and loaded. 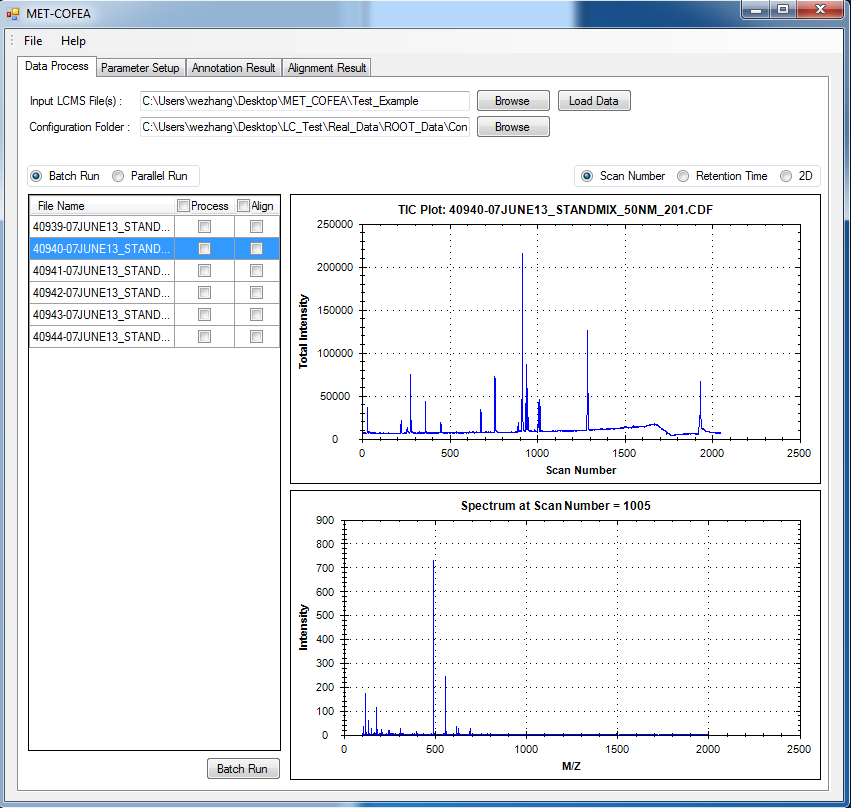 Fig. 4 Raw data visualization and pipeline processing by MET-COFEA 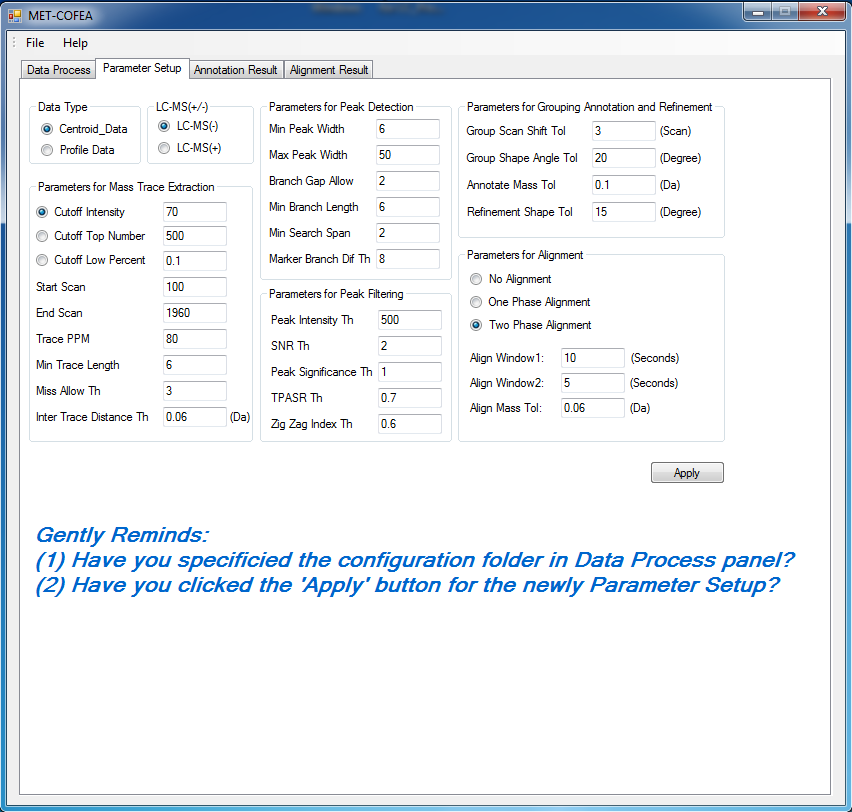 Fig. 5 MET-COFEA parameter configuration Once the analysis for one sample finished, MET-COFEA, utilizing SQLite technique, will output a database file named as xxx.db. User can visualize the detail of grouping and annotation results. Fig.6 and Fig.7 give screenshots of the associated peaks for the same Group_ID and Compound_ID. The peak list with the same Group_ID are close in peak shape and retention time while the sub-peak list with the same Compound_ID have the inner relationship among each observed m/z value and the deduced molecular mass, and can be used to elucidate the annotated metabolite compound’s structure. The constructed pseudo-spectrum with the same Group_ID/Compound_ID can be exported as a txt file. 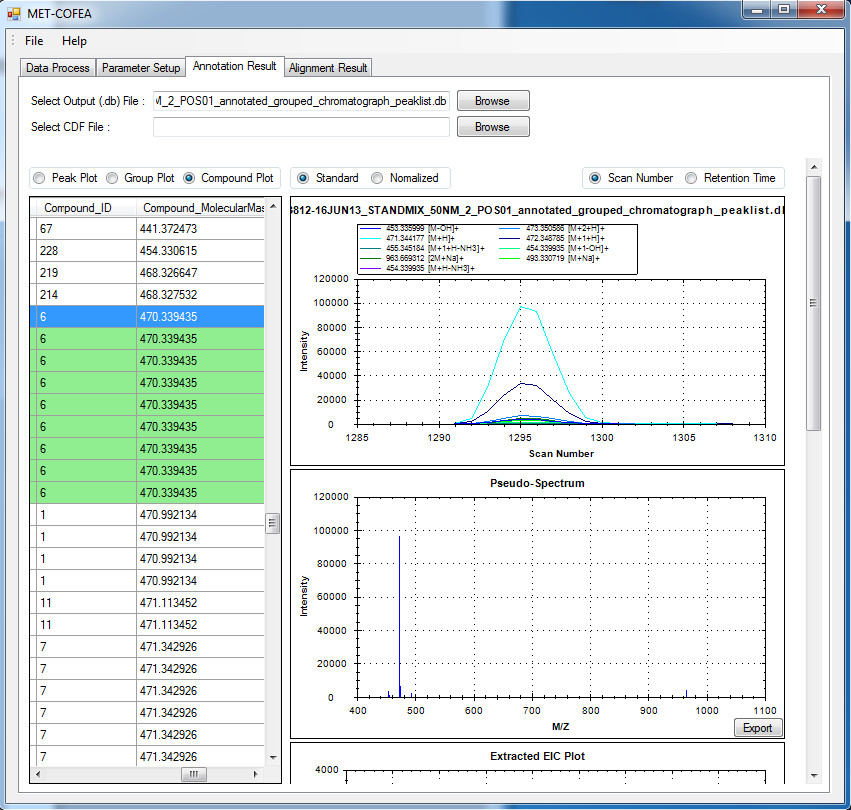 Fig. 6 Visualization of MET-COFEA annotation results for annotated peaks with the same Compound_ID 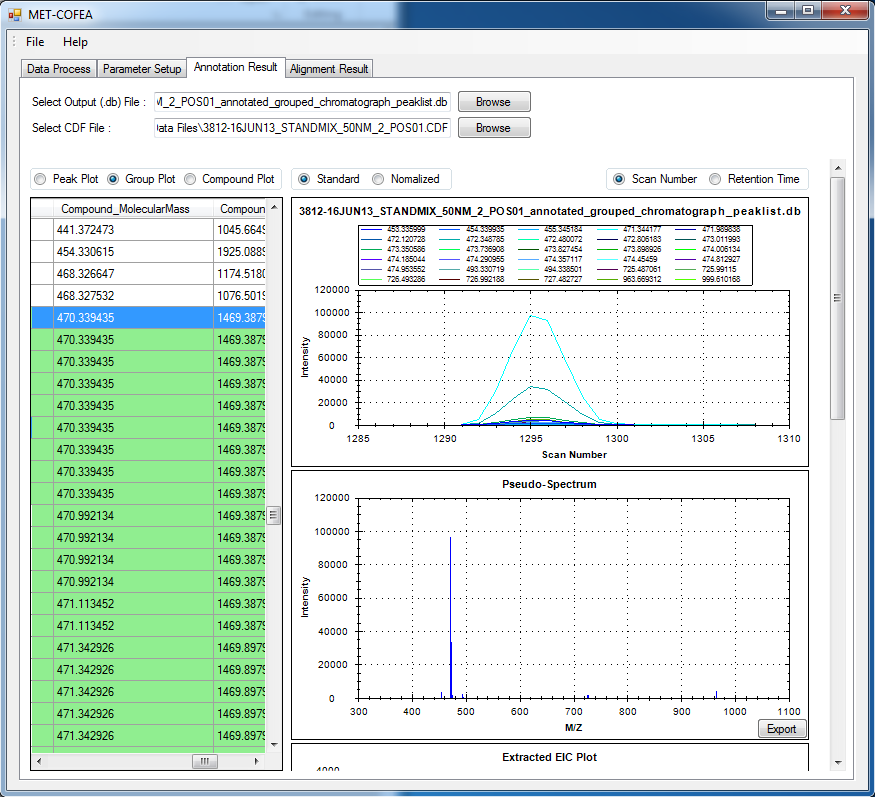 Fig. 7 Visualization of MET-COFEA annotation results for grouped peaks with the same Group_ID Once the alignment across samples is finished, MET-COFEA, utilizing SQLite technique, will output a database file named as aligned_annotated_grouped_chromatograph_peaklist.aligndb. User can visualize the detail of alignment results. Fig.8 and Fig.9 give screenshots of the associated peaks for the same Align_ID at the original retention time and corrected retention time. The annotated compound associated peaks can be aligned together if the deduced compound molecular mass and retention time fall in the user specific tolerance. 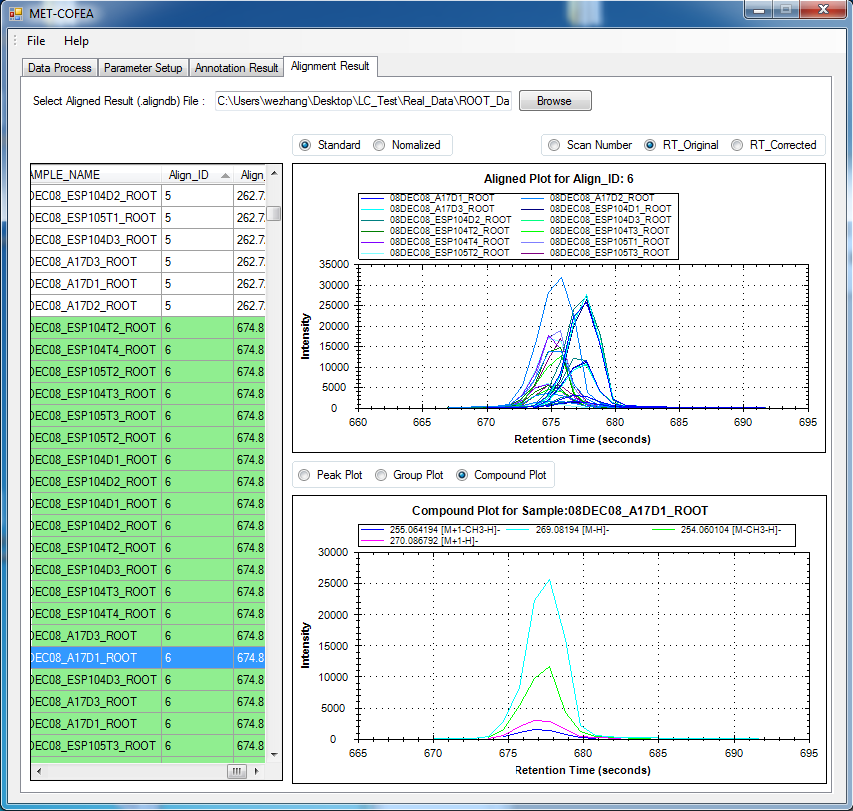 Fig. 8 Visualization of MET-COFEA alignment results displayed at original RT 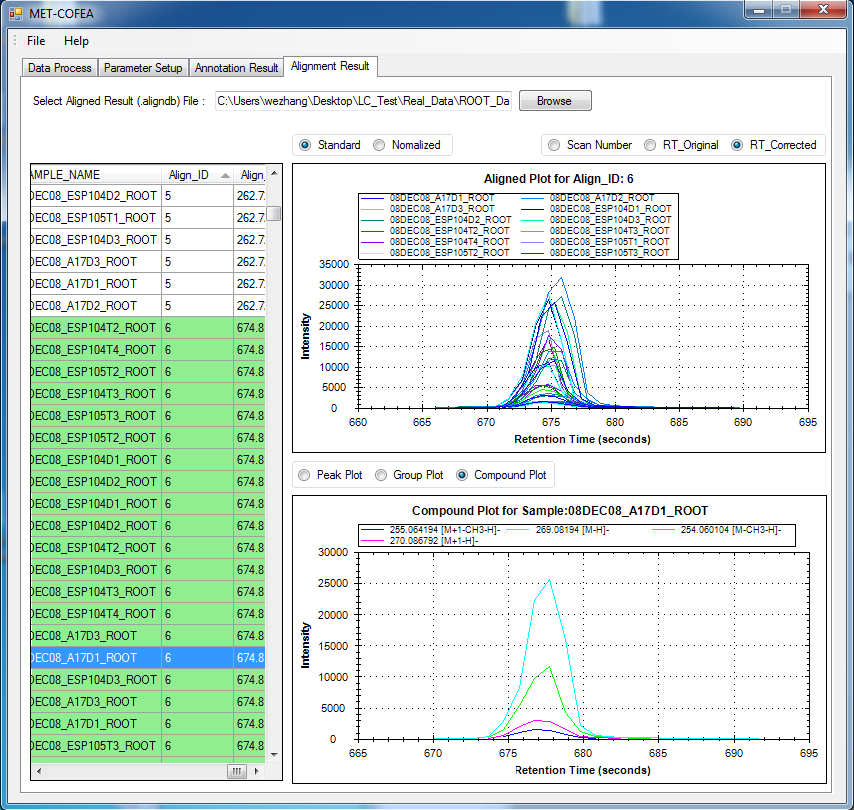 Fig. 9 Visualization of MET-COFEA alignment results displayed at corrected RT Additionally, MET-COFEA, can be extended into LC-MS based comparative metabolomics study by combining with our another Tool entitiled as MET-XAlign. For any questions or suggestions about MET-COFEA, pls feel free to contact: bioinfo AT noble.org |