MAD-HiDTree: A Tool for Multiple Accessions' Distinguishing through Hierarchical Decision Tree
|
Overview In the project of mutagenesis or Hapmap, several hundred of individual accession/lines are generated and sequenced. Based on these accessions and sequence data, the relationship between the observable phenotype and the causative genotype markers can be correlated or associated. However, there are some practical questions existing: whether and how these accessions/lines can be distinguished to each other? Unfortunately, there is no such software or tool that can answer these questions. In order to address the above questions, MAD-HiDTree, being as a web tool, was dedicatedly developed. Use the genotype marker matrix data only, MAD-HiDTree can distinguish the multiple accessions by some recursive procedures such as set partitioning and Hierarchical Decision Tree (HiDTree) constructing. Based on the constructed HiDTree, the accession at the tree leaf and the path that recorded the markers and genotype value can specific distinguish this accession with other accessions. Rationale The genotype marker matrix data is the only required input data, which can be output from the original Hapmap genetic variant data(as format of .vcf or .bcf ) by bcftools and some criteria filtering script. The columns of the genotype marker matrix correspond to multiple accessions, and the rows corresponds to the markers. For each marker (row), the entries at different columns are the genotype values recorded for the corresponding accessions, which can be homogenous genotype as "0/0", "1/1", or heterogeneous genotype as "0/1", or unknown genotype as "./.". The homogenous genotypes can be stably passed into their descendants, and the different homogenous genotypes of the same marker can be used as a decision to partition the accession set into different sub-sets. Multiple genotypic markers are promising to construct a hierarchical decision tree and distinguish each specific accession from other accessions. Fig.1 depicts the rationale how the large accession set can be classified into several sub-sets by 2 genotypic markers. When compared with the inputting large accession set, the outputting sub-sets become more specific.  Fig. 1 The illustration of a large accession set(10 accessions) was classified into several specific sub-accession sets The above principle for accession set partitioning and hierarchical tree constructing can be recursively proceeded. During the inputting accession set are partitioned and further recursively partitioned by several markers, a hierarchical tree can be simultaneously be created from the tree root (the first marker) to the tree branches (intermediate markers), until the final tree leaves (outputting sub-set, or specific accession set). Fig.2 illustrates (a) how the top accession set is partitioned and recursive partitioned into 4 specific sub-sets, and how the hierarchical tree was simultaneously built. Here, 3 markers were involved, and 4 sub-sets are output. Herein, the output hierarchical tree contains 3 marker nodes and 4 sub-set nodes. 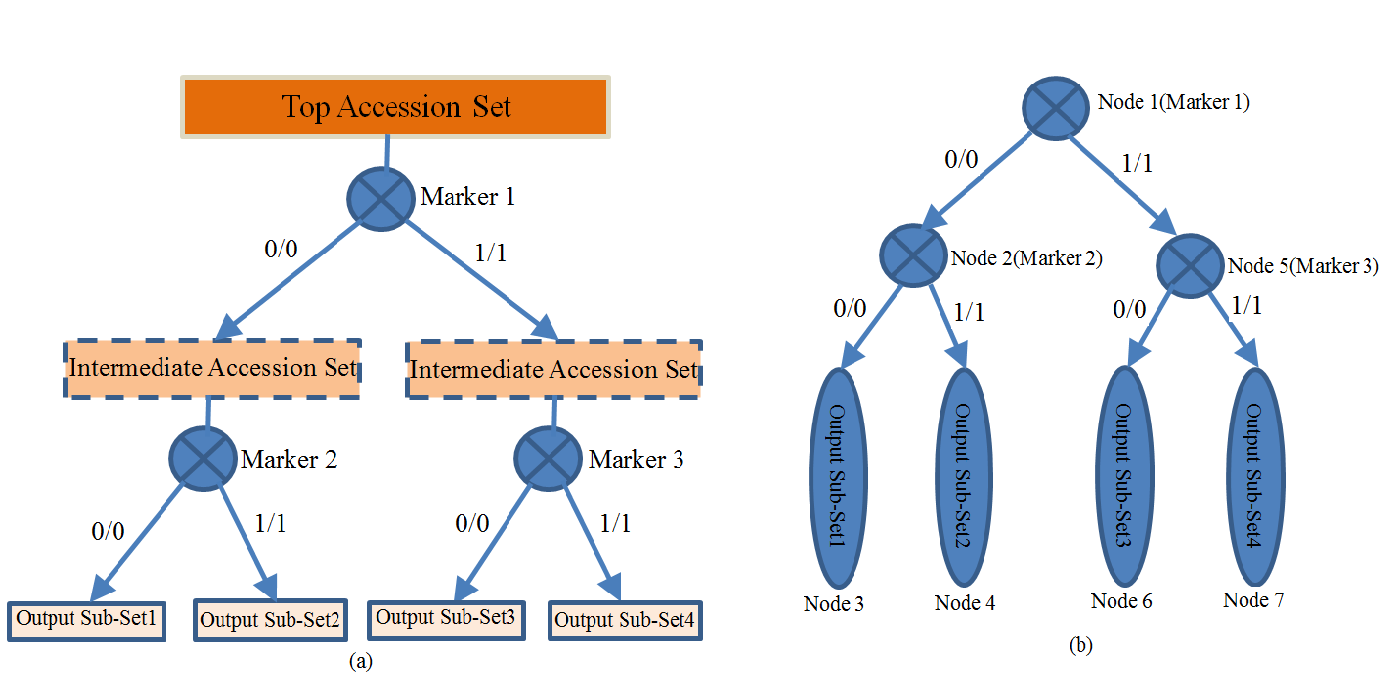 Fig. 2 Illustration of (a) the set partitioning of the top accession set into 4 sub-sets by 3 markers, and (b) the hierarchical tree constructing by 7 nodes (4 sub-set nodes and 3 marker nodes) Representative Applications of MAD-HiDTree If your genotype marker matrix data is avaliable, just submit it to MAD-HiDTree. To Medicagohapmap project, you can get the original genetic varaint data file from their website, and use bcftool and some script to extract the required genotype marker matrix file. Another web tool to extract the required marker information from the original .bcf files is under development. Once the genotype marker matrix file is submitted, MAD-HiDTree will return 3 text files which correspond to the selected marker list, the partition result for the output sub-sets, and the hierarchical decision tree. An example genotype marker matrix file can be downloaded from here, and this genotype marker matrix consist of 262 accessions(columns) and 1384 markers(rows). We upload this file and configure MAD-HiDTree with the default parameters. Then, we got 3 returning files: HiDTree.txt, MarkerList.txt, and SubsetList.txt. Using the returning fileHiDTree.txt, the plot and layout of the hierarchical tree can be implemented by a Matlab Script. Fig.3 provided the figure of the tree layout generated by the Matlab script. 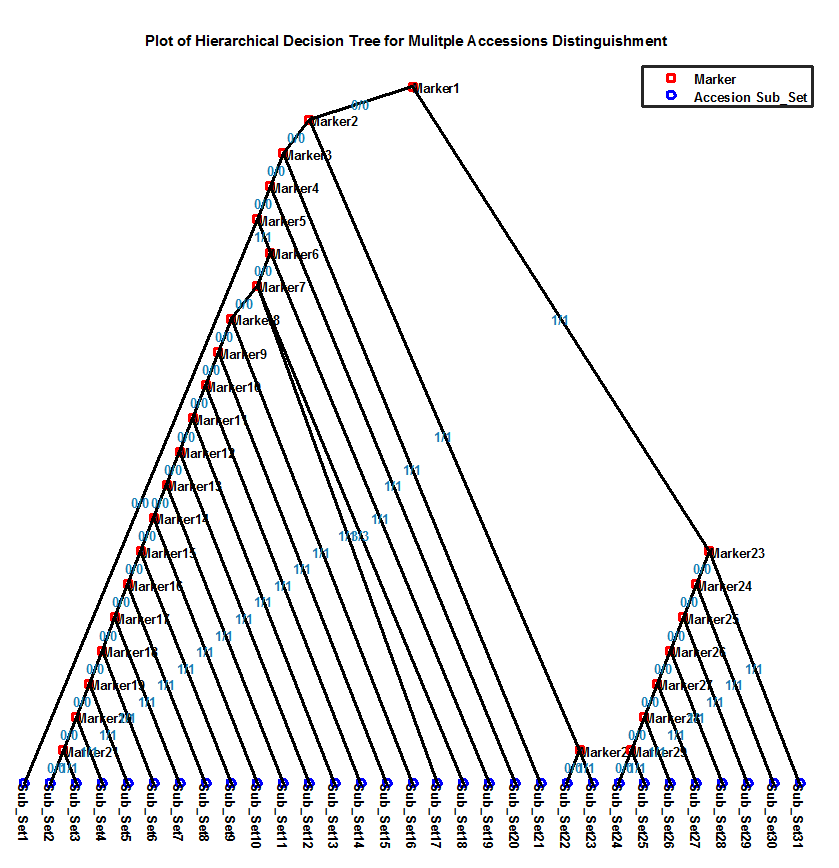 Fig. 3 The Layout of the Hierarchical Decision Tree From fig.3, the outputing sub-sets can provide more specific information for the distinguishment when compared with the input accession set, additionally, the markers and the labled genotypes clearly specific the information for the distinguishment of sub set. Reference: 1. Yang, Jian, et al. "GCTA: a tool for genome-wide complex trait analysis." The American Journal of Human Genetics 88.1 (2011): 76-82. 2. Zhang W, Dai X, Wang Q, Xu S, Zhao PX, PEPIS: A Pipeline for Estimating Epistatic Effects in Quantitative Trait Locus Mapping and Genome-Wide Association Studies, 2016. PLoS Comput Biol, 12(5). 3. Said, Amir, and William A. Pearlman. "A new, fast, and efficient image codec based on set partitioning in hierarchical trees." IEEE Transactions on circuits and systems for video technology 6.3 (1996): 243-250. 4. http://www.medicagohapmap.org/. |