 |
MET-XAlign:
A Metabolite Cross Alignment Tool for LC-MS based Comparative Metabolomics
|
|
|
||
|
| Location: Introduction | |
|
Liquid chromatograph coupled with mass spectrometry (LC/MS) has several advantages over gas chromatograph coupled with mass spectrometry (GC/MS) approaches. For example, LC/MS does not require derivatization for polar compounds, is capable of analyzing a larger range of compounds, commonly uses low-energy electrospray ionization (ESI), and provides greater sensitivity. So, untargeted metabolomics, especially comparative metabolomics based on LC-MS has been widely used to identify biomarkers by comparing the shared differences among the detected biological meaningful features from hundreds to thousands of LC-MS samples that may be produced from multiple well designed comparative experiments. However, until now, there is no universal LC-MS libraries that can be used to elucidate the metabolite’ chemical structure and then to specifically identify the metabolite, because the fragmentation pattern for the same metabolite can vary greatly due to different instrument type and different experiment setting such as solvent type, voltage, ionization polarity. Additionally, retention time shift also need to be carefully considered, which can be greatly affected by the analytical conditions such as temperature, pressure, and humidity. The varying fragmentation pattern and retention time shift together make it a challenge to identify the meaningful biomarker from the hundreds to thousands of LC-MS samples but acquired at different experiment configurations, which greatly impeded the LC-MS based comparative metabolomics study. So, an efficient Tool that can align the same potential metabolites across not only from different samples, but also from different biological experiments, different instruments, is more attractive and urgent. For approaching this aim, we have developed two tools: MET-COFEA and MET-XAlign, which can be used together in LC-MS based comparative metabolomics study. MET-COFEA. MET-COFEA, being an analysis tool, can be used to extract and annotate each meaningful metabolite’ associated chromatograph features from each LC-MS sample. For the extracted metabolite compound group with multiple fragment peaks, the neutral molecular mass can be deduced and the compound’s representative retention time can be estimated, which can be considered as the common thing for the same metabolite across different samples and different experiment configurations, although the fragmentation pattern can vary from sample to sample, from experiment to experiment. MET-COFEA has already been successfully implemented as a pipeline tool with visualization. MET-XAlign. MET-XAlign, being as an alignment tool, has been dedicatedly developed based on the analysis results from MET-COFEA. It mainly includes an algorithm core and user interface. The identified compounds from MET-COFEA are characterized by compound retention time and neural molecular mass deduced by multiple associated fragments’ m/z value, which are represented as its unique Compound_ID. MET-XAlign loads all of the analysis results from MET-COFEA, and aggregated the annotated compound across all samples. If the compound molecular mass and retention time fall in an acceptable tolerance, the compounds across different samples will be aligned together. Just like the traditional peak alignment procedure, there are two important criteria for compound alignment: reference determination criteria and alignment strategy criteria for the reference compound and matching sample compound. Comparative Metabolomics study using MET-COFEA and MET-XAlign. Adopting this approach that combined MET-COFEA and MET-XAlign, the LC-MS based comparative metabolomics analysis including metabolite feature extraction and annotation for each sample and alignment across samples can be separated. The user can configure the optimal parameters according to each biological experiment setting and run MET-COFEA to analyze the corresponding samples at pipeline mode, which will extract and annotate all of metabolites’ associated feature list and output them as database files. Finally, all of the exported database files from MET-COFEA can be aggregated and analyzed in MET-XAlign according to the user configured optimal alignment parameters. Fig.2 gives the flowchart of comparative metabolomics study using MET-COFEA and MET-XAlign. The approach that combination of MET-COFEA with MET-XAlign makes it possible to align the potential same metabolite compound(known or unknown) not only across different samples, but also across different biological experiments, different ESI models, even different instruments, which is very common in comparative metabolomics study. 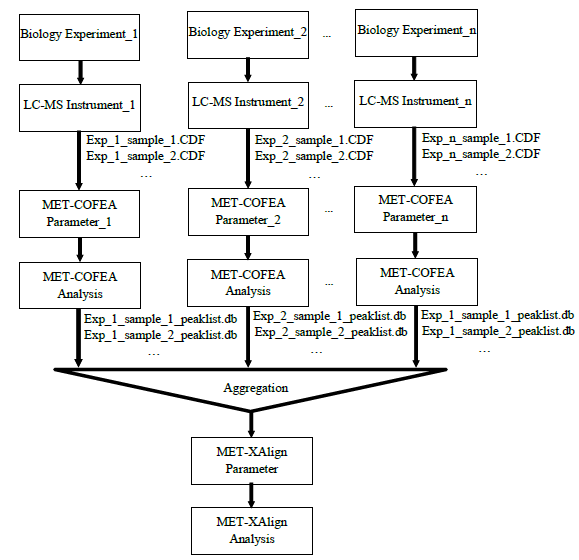 Fig.2 Flowchart of Comparative Metabolomics study using MET-COFEA and MET-XAlign. Figure.3 gives the snapshots of MET-COFEA’ data processing property page and parameter setup property page when process the data samples from different experiment sets that marked as ‘NEG_50NM’ and ‘POS_5NM’ respectively. 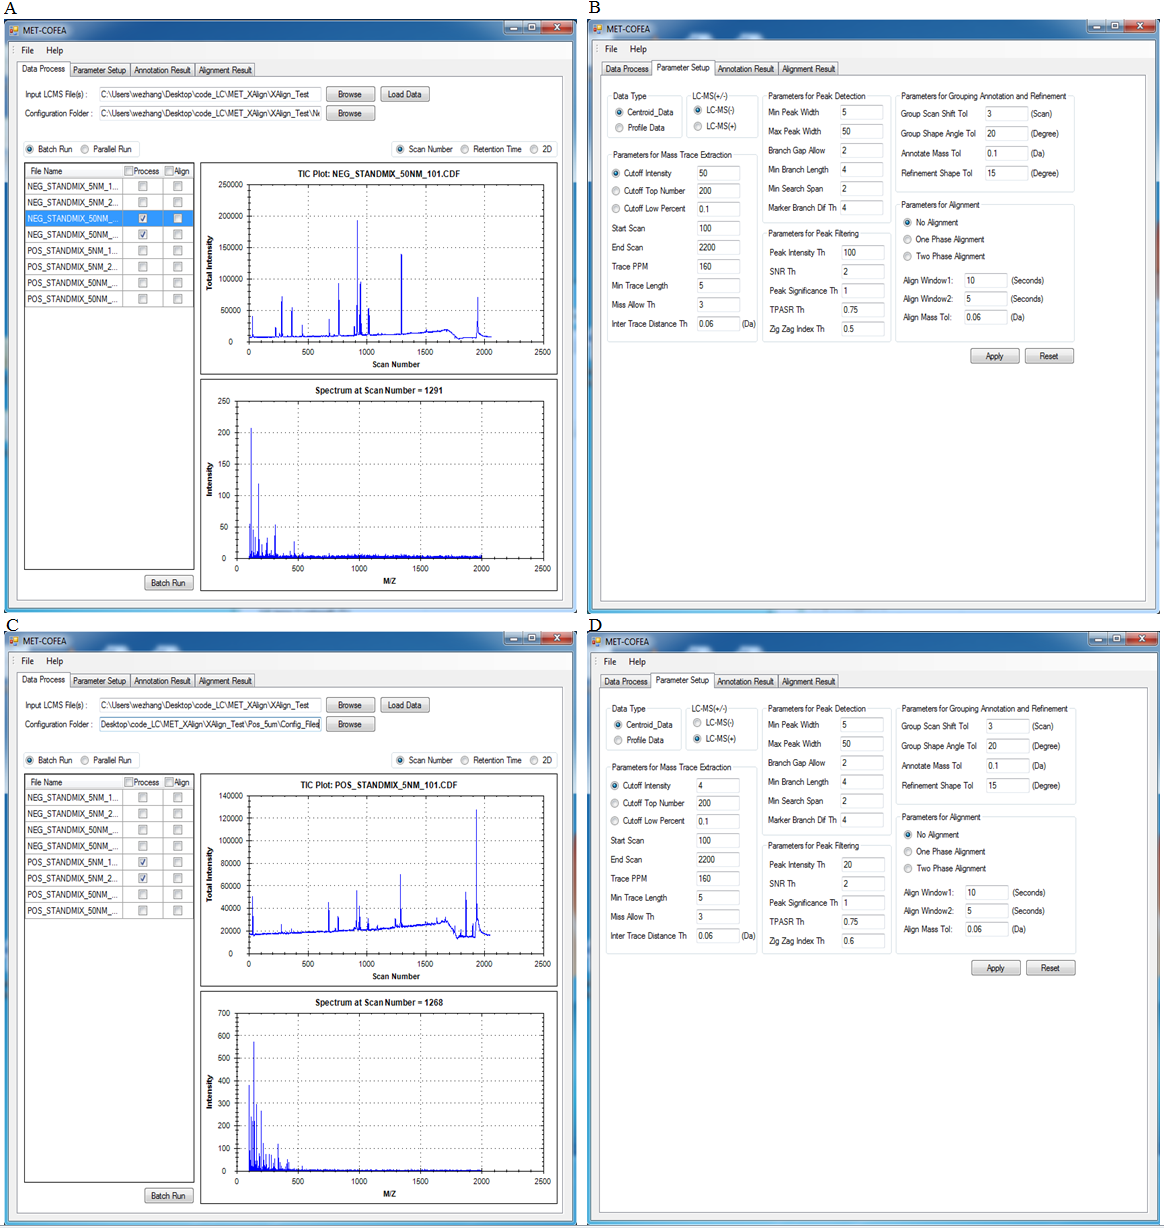 Fig.3 MET-COFEA user interface. A and C: snapshot of data processing property page for processing experiment set of ‘NEG_50NM’ and ‘POS_5NM’. B and D: snapshot of parameter setup property page when process the experiment set of ‘NEG_50NM’ and ‘POS_5NM’. Figure.4 gives the snapshots of MET-XAlign’ Align_Process property page when use MET-XAlign to align the analysis result from MET-COFEA across samples. 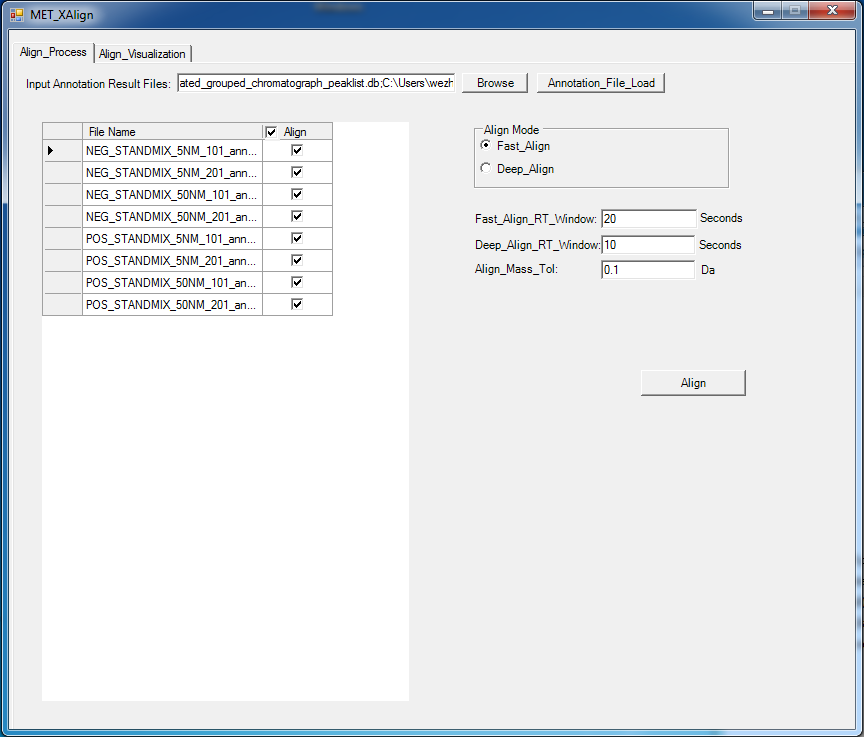 Fig.4 Snapshot of MET-XAlign’ Align_Process property page. Figure.5 gives an example of alignment visualization by MET-XAlign. 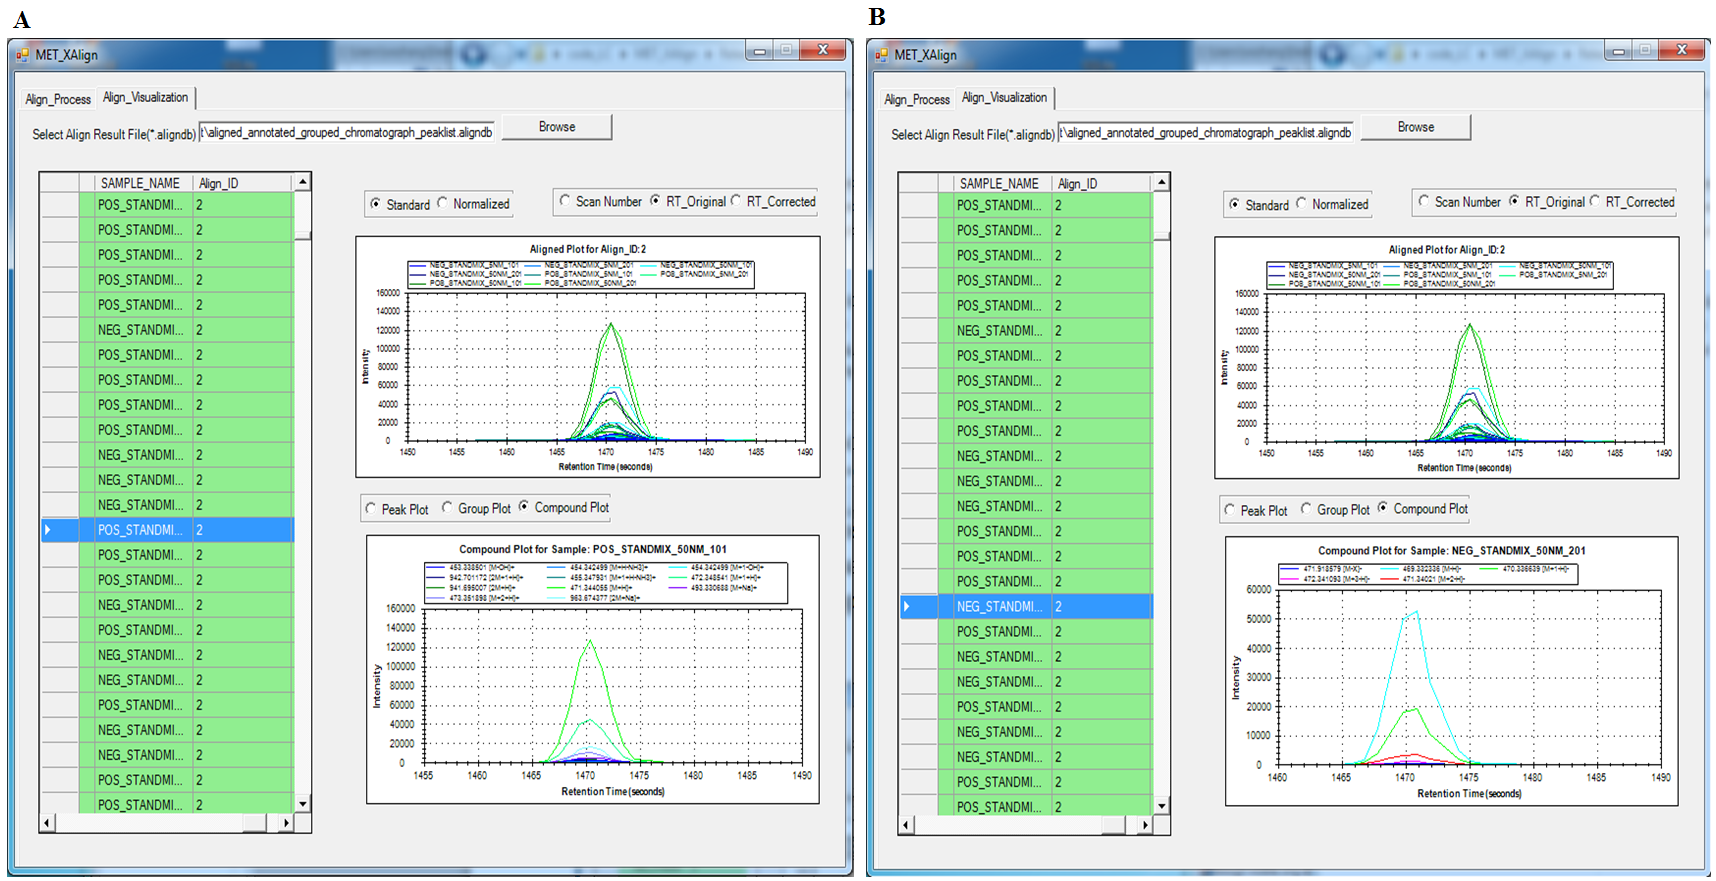 Fig.5 Visualization of alignment result of MET-XAlign for the same metabolite named as ‘18 beta-Glycyrrhetinic acid’ and marked by its unique Align_ID=2. A: The annotated metabolite’ fragment peaks from sample ‘POS_STANDMIX_50NM’ are plotted in the right bottom panel. B: The annotated metabolite fragment peaks from sample ‘NEG_STANDMIX_50NM’ are plotted in the right bottom panel. For any questions or suggestions about MET-XAlign, pls feel free to contact: bioinfo AT noble.org |