PATOWAS: A Pipeline for Analyzing Trait through 'Ome'- wide Association Studies
|
Overview PATOWAS is a pipeline that is dedicatedly developed for Trait Analying through Associative Omics, or Ome-Wide Association Studies. Commonly, the user upload their coded genotypic data, or gene expression data, or metabolite abundance data and the trait related phenotypic data, then the kinship matrices, mutiple variance components' ratio, and comprehensive p-value mapping to the target quantitative trait can be calculated, analyzed and estimated. The results from PATOWAS can be integrated and/or compared for integrative and comparative omics analysis, which can help breeders to understand the mechanisms of complex quantitative trait in a system biology viewpoint, and then develop the more efficient breeding programs. Pipeline Flowchart The whole pipeline include two sequential sub-pipelines: Pipeline 1 is responsible for the calculating and outputting the kinship matrices based on the user-uploaded quantatilative omics data files, while pipeline 2, based on the inputting trait related phenotypic data and the outputting kinship matrices from pipeline 1, is responsible for estimating the mutiple components' contribution to the specific trait, and the 1D/2D p-value profiles for main additive/interaction effects. Additionally, the Kinship matrix calculation and interaction p-value scanning need more calculations, and implemented in parallel structures. Fig.1 gives the pipeline flowchart of PATOWAS. 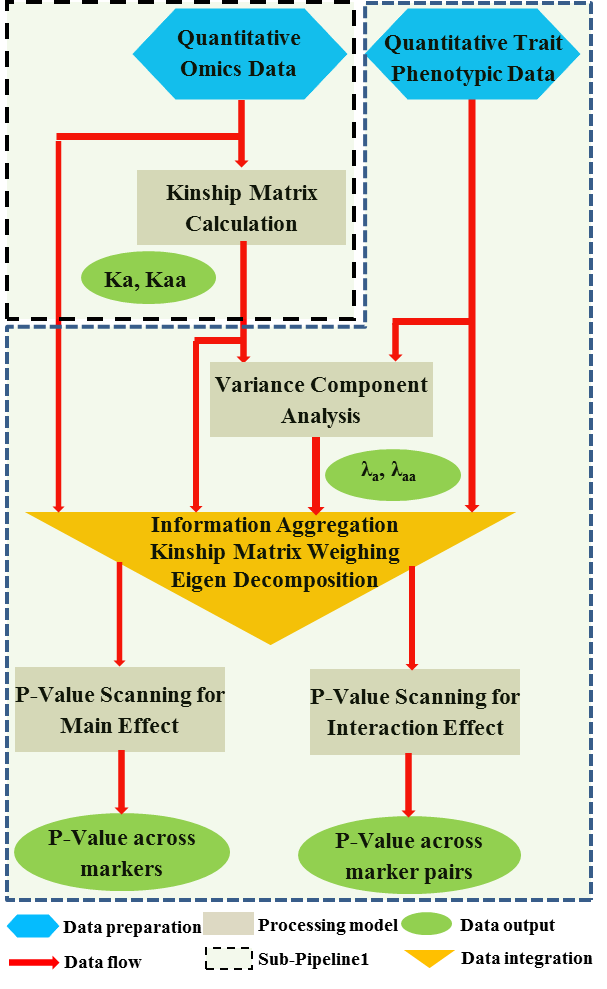 Fig. 1 Pipeline Flowchart of PATOWAS for Trait Analysis though Ome-wide Association Mapping Representative Case Applications of PATOWAS for Ome-Wide Trait Analysis Currently, PATOWAS supports multiple representative omics applications. One of the quantalative omics marker(genotypic/expressed gene/observed metabolite) matrix data file, and the trait related phenotype data are provided, PATOWAS can analyze the trait in genomic/transcriptomics/metabolomics level. Each marker matrix data is stored as mxn matrix,and the phenotype data is stored as a nx1 vector. 1. Analysis Flowchart 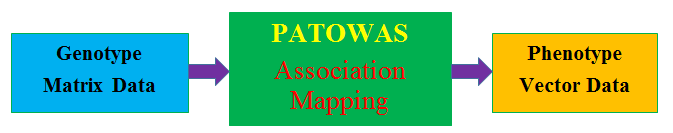 Fig. 2 Analysis Flowchart of PATOWAS for G2P Association Mapping 2. The genotype marker matrix data Matrix_Genotypes.txt and phenotype vector data Vector_Phenotypes.txt . Here, the marker data is a mxn matrix, m(rows) correspond to marker number and n(cols) corresponds to individual number. Additionally, the genotypic marker data are encode as [-1,0,+1] for two homozygous genotype and one heterozygous genotype 3. Illustration of the Analysis Result 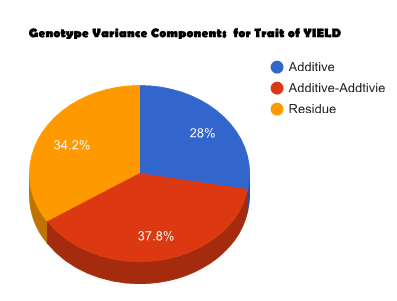 Fig. 3 Illustration of Variance Component thorugh G2P Association Mapping 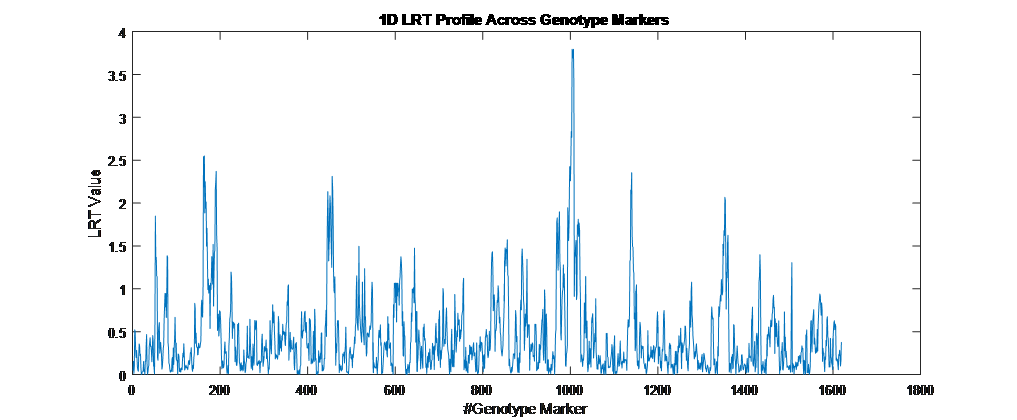 Fig. 4 Illustration of 1D LRT Profiles for Trait across all the Genotype Markers 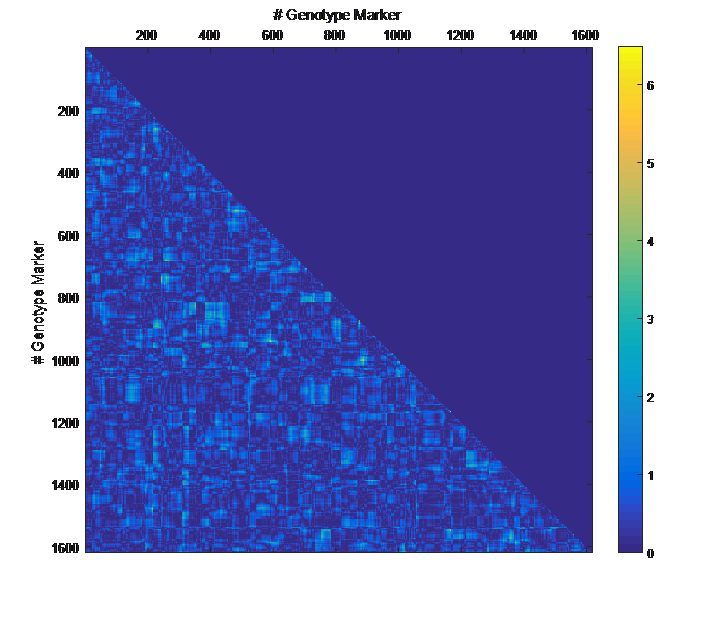 Fig. 5 Illustration of 2D LRT Profiles for Trait across all the Pairwise Genotype Markers 1. Analysis Flowchart 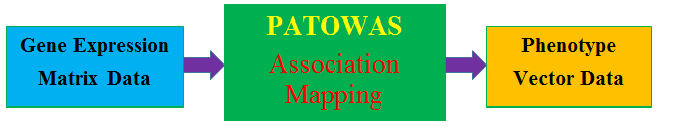 Fig. 6 Analysis Flowchart of PATOWAS for T2P Association Mapping 2. The expressed gene marker matrix data Matrix_Expressions.txt and phenotype vector data Vector_Phenotypes.txt . Here, the marker data is a mxn matrix, m(rows) correspond to marker number and n(cols) corresponds to individual number. 3. Illustration of the Analysis Result 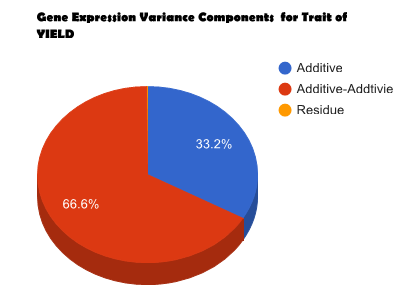 Fig. 7 Illustration of Variance Component thorugh T2P Association Mapping 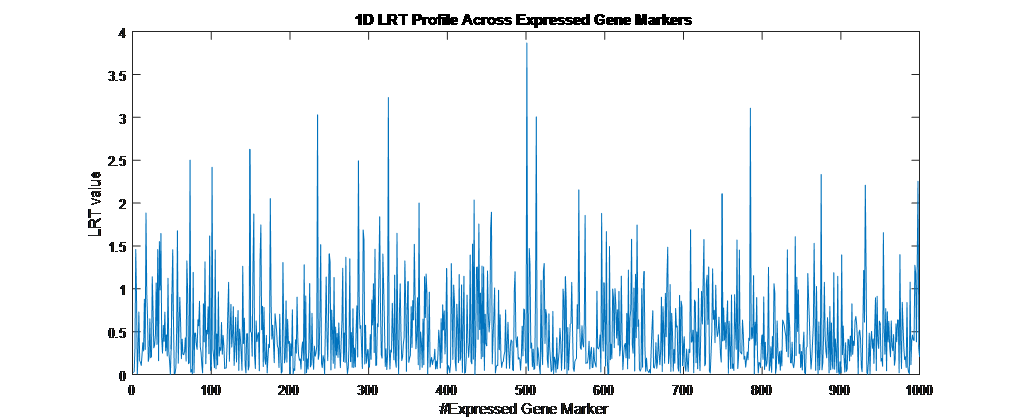 Fig. 8 Illustration of 1D LRT Profiles for Trait across all the Expressed Gene Markers 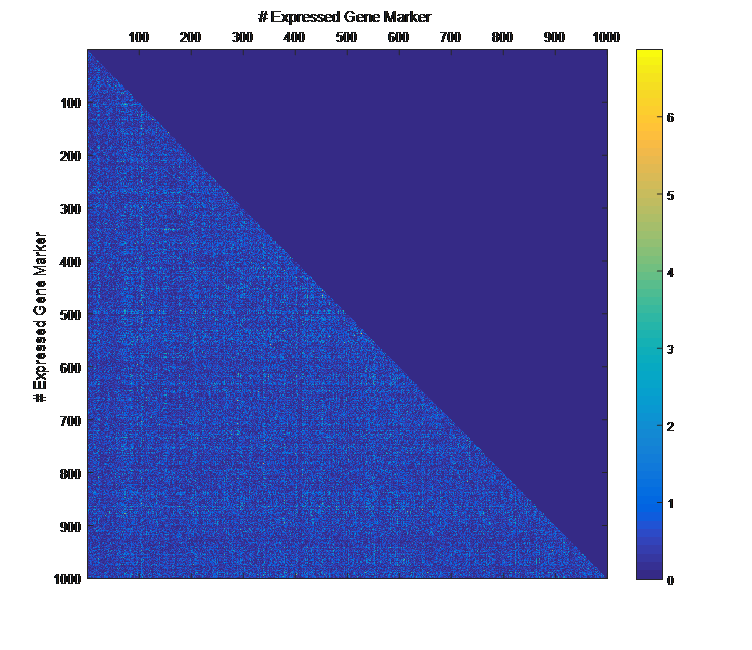 Fig. 9 Illustration of 2D LRT Profiles for Trait across all the Pairwise Expressed Gene Markers 1. Analysis Flowchart 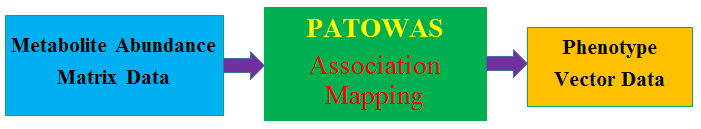 Fig. 10 Analysis Flowchart of PATOWAS for M2P Association Mapping 2. The observed metabolite marker matrix data Matrix_Metabolites.txt and phenotype vector data Vector_Phenotypes.txt . Here, the marker data is a mxn matrix, m(rows) correspond to marker number and n(cols) corresponds to individual number. 3. Illustration of the Analysis Result 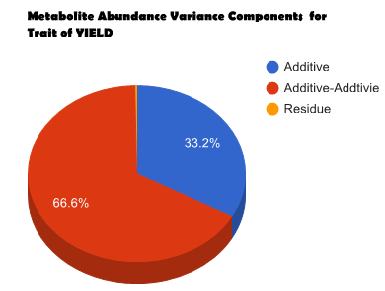 Fig. 11 Illustration of Variance Component thorugh M2P Association Mapping 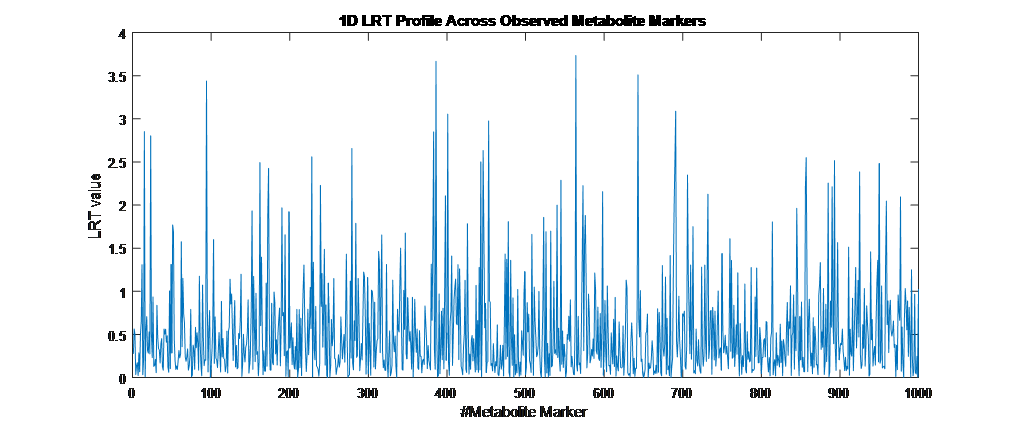 Fig. 12 Illustration of 1D LRT Profiles for Trait across all the Metabolite Markers 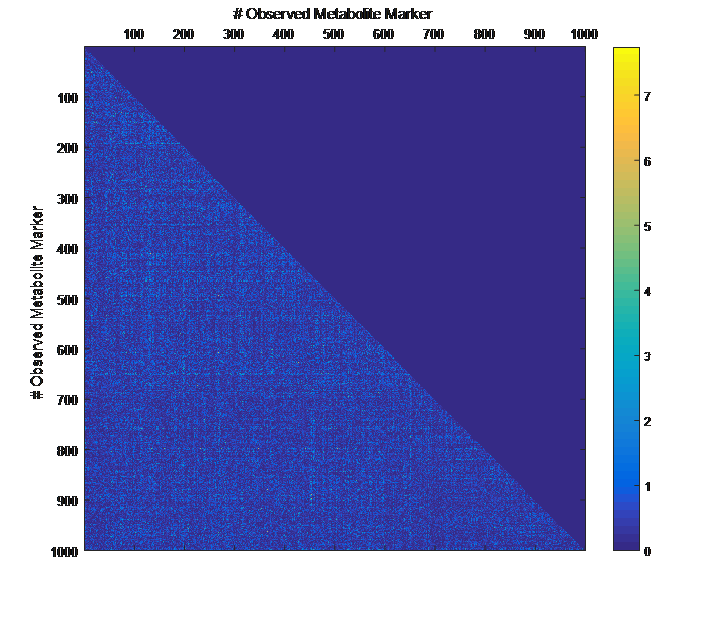 Fig. 13 Illustration of 2D LRT Profiles for Trait across all the Pairwise Metabolite Markers Representative Case Applications of PATOWAS for Integrative and Comparative Omics Analysis Mulitiple omics analysis result for the same trait can be integrated and compared, which can provide a comprehensive systems biology viewpoint. The variance component analysis result from PATOWAS contain three components (additive, addtivie-additive, residual) , the higher the two biological meaningful components (additive, and additive-additive) , the more the phenotypic variance can be explianed by the model. Fig. 14 show us that there are more residual part in assoctive genomics , but nearly all the phneotypic variance can be explianed in associative transcriptomics and associative metabolomics . 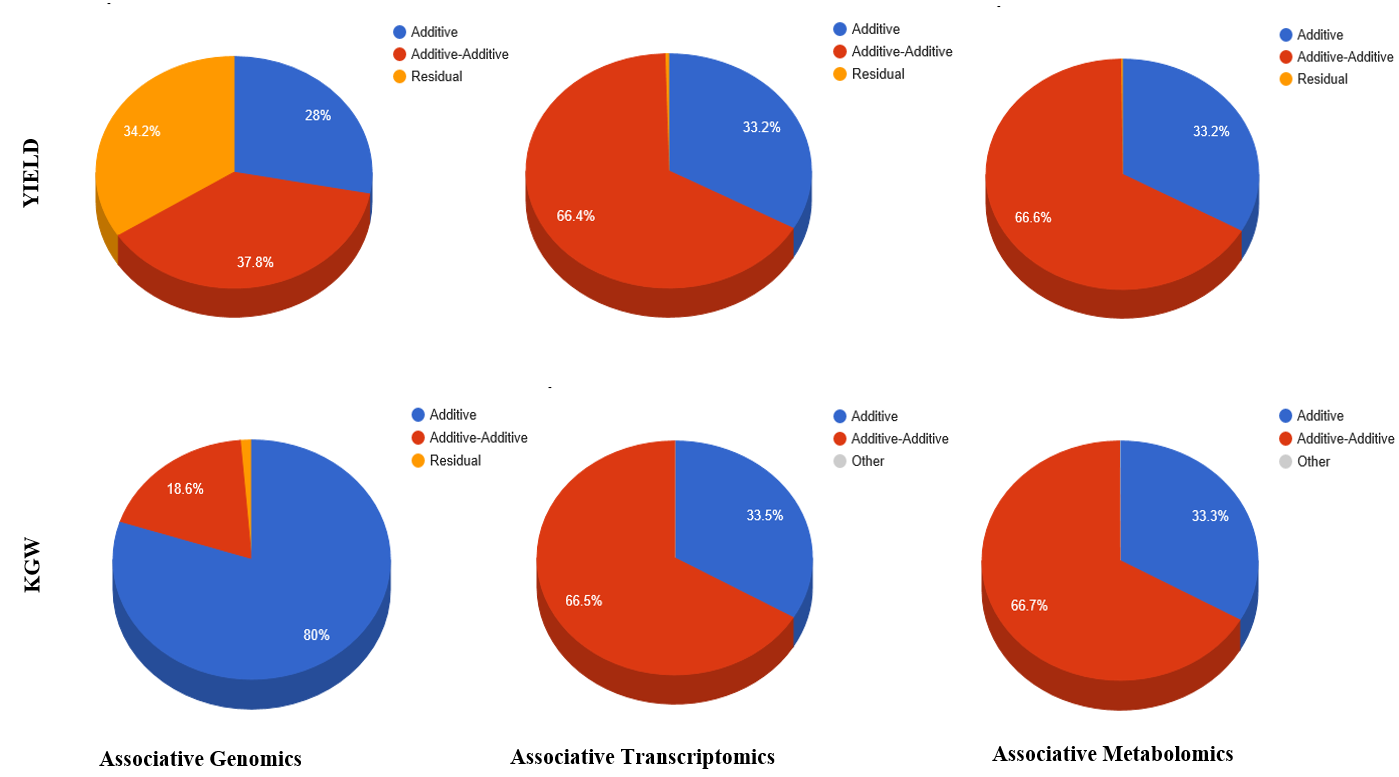 Fig. 14 Integrative illustration of variance component analysis results for trait YILED and KGW across three associative omics The associated genotypic markers and associative transcript markers can be physically algined to the chromosomal position . The integrative analysis result in Fig.15 shows us that the trait KGW, compared with trait YIELD , is a high-heritable trait, because there are more matched significant regions between G2P and T2P . The associative transcriptomics capture not only the genetic information , but also the intermediated envrionmental information . 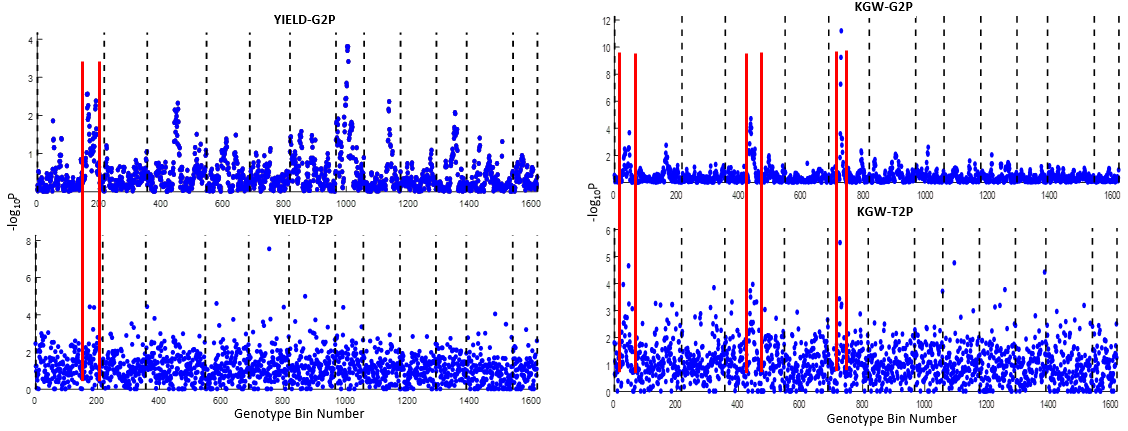 Fig. 15 Integrative illustration of chromosomal position consistency between genomics and transcriptomics markers Fig. 16 show that there are more significant leaf metabolites that are revelant to trait YILED , while there are more significant seed metabolites that are revelant to trait KGW . This results can be easily understand by the fact that the photosynthesis process take place mainly in leaf tissue and is also the main factor determing the rice yield . 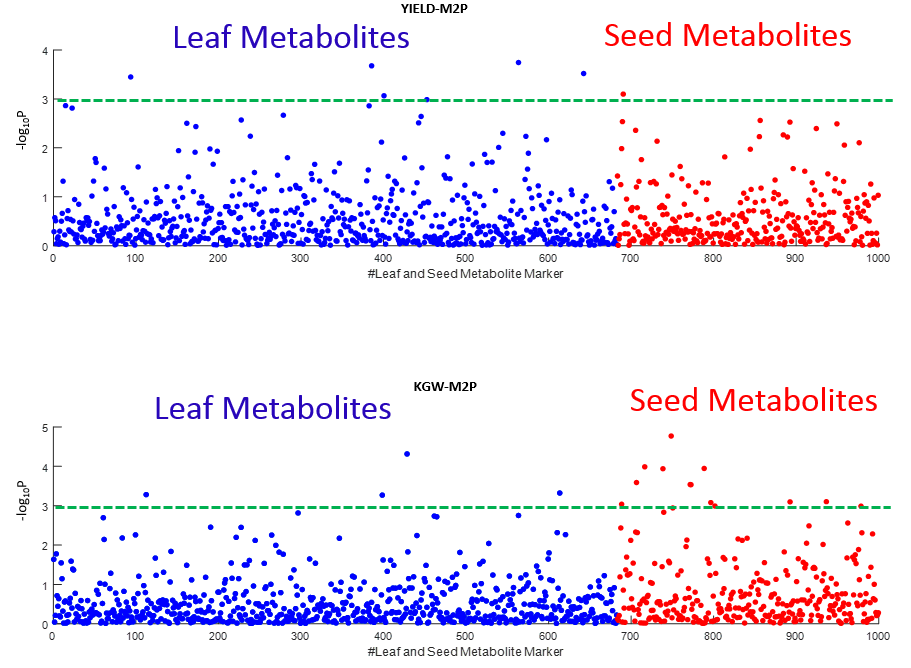 Fig. 16 Comparative illustration of 1D M2P association mapping results across different traits and different tissues Reference: 1. Xu, S., Mapping Quantitative Trait Loci by Controlling Polygenic Background Effects. Genetics, 2013. 195(4):p.1709-23. 2. Zhang W, Dai X, Wang Q, Xu S, Zhao PX, PEPIS: A Pipeline for Estimating Epistatic Effects in Quantitative Trait Locus Mapping and Genome-Wide Association Studies, 2016. PLoS Comput Biol, 12(5). 3. Zhang, W., Dai, X., Xu, S., & Zhao, P. X. (2018). 2D association and integrative omics analysis in rice provides systems biology view in trait analysis. Communications Biology, 1, 153. http://doi.org/10.1038/s42003-018-0159-7. |