To support the continuous development of DeGNServer, please cite: DeGNServer: Deciphering Genome-scale Gene Networks through High Performance Reverse Engineering Analysis, BioMed Research International, vol. 2013, Article ID 856325, 2013, doi:10.1155/2013/856325
The Zhao Bioinformatics Laboratory
DeGNServer:Deciphering Genome-Scale Networks through High Performance Reverse Engineering Analysis          
 
Location:   Home  >  Help
1. The pipeline of our web server

DeGNServer integrates six association methods for co-expression gene network analysis, then utilizes Context Likelihood of Relatedness to construct a network through removing some false positive gene interactions. If user only focus on coexpression network analysis, you can choose coexpression network analysis option in our Data Analysis page

In our data analysis page,


2. Expression Data formats:

Our server only reads TAB-delimited text files that describe an expression data set. Such files can be created and exported in any standard spreadsheet program, such as Microsoft Excel An example data set is provided in our data analysis page.


Figure 1. Expression Data File format


3. Data formats for Seed-specific Probset ID/Gene List:

Each line contains a Probset ID/Gene in this file. Meanwhile,please make sure the name of Probset ID/Gene are same as the Probset ID/Gene in your expression data set.

Figure 2. Probset ID/Gene List File format


4. Network Type:

Our server provides two methods to construct network. One is CLR-based method(Ref. 1), the other one is valued-based coexpression network(Ref.2). In the value-based (rank-based) method, two genes are connected if the (rank-transformed) similarity between their expression profiles is above a certain threshold. Similarities may be measured by Pearson correlation coefficient or other metrics In order to identify regulatory interactions CLR method computes the MI between the expression levels of every possible regulator-target gene pair, and then computes a score for each pair. The score for a pair is a function of two z-scores resulting from comparing the pair's MI value with: all MI values involving the regulator (to generate the regulator z-score), and all MI values involving the target (to generate the target z-score). CLR takes advantage of the fact that biological networks are, on average, quite sparse and assumes the majority of MI values involving a given target or regulator are insignificant, and thus constitute a background MI distribution. Actually, such kind of assocation could not only be measured by mutual information, but also measured by other different kinds of association methods such as pearson correlation,spearman correlation.


5. Correlation Estimation Method

Our server provide five methods to calculate association for all gene pairs: Spearman's rank correlation method,Pearson's correlation, Mutual Information-based,Kendall's rank correlation have been detailed introduced in ref(2); Maximal information coefficient(MIC) is introduced in ref(3); Mutual information-based is introduced in ref(1)


6. Community structure Finding Method:

Our server provide two methods to mine subnetwork and functional module from the constructed gene network. The first method is based on the SNBuilder in ref(5). The second method called as GeNa method is developed in ref(4).


7. Association cutoff

In the value-based (rank-based) method, two genes are connected if the (rank-transformed) similarity between their expression profiles is above an asscociation cuttoff; In the CLR (context likelihood of relatedness) method(Ref.1), z-score is used to depict gene regulatory for gene pairs through converting the gene association value to z-scores, effectively removed indirectional interaction. Higher z-score cutoff means the high confidence of the constructed network. A detail introduction about this method is introduced in Ref.1.


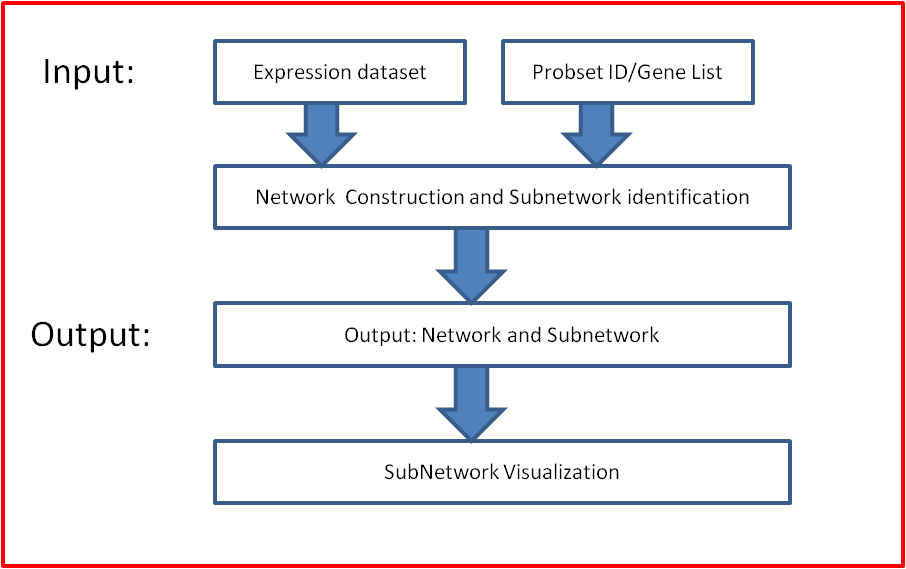
8. Output and Visualization

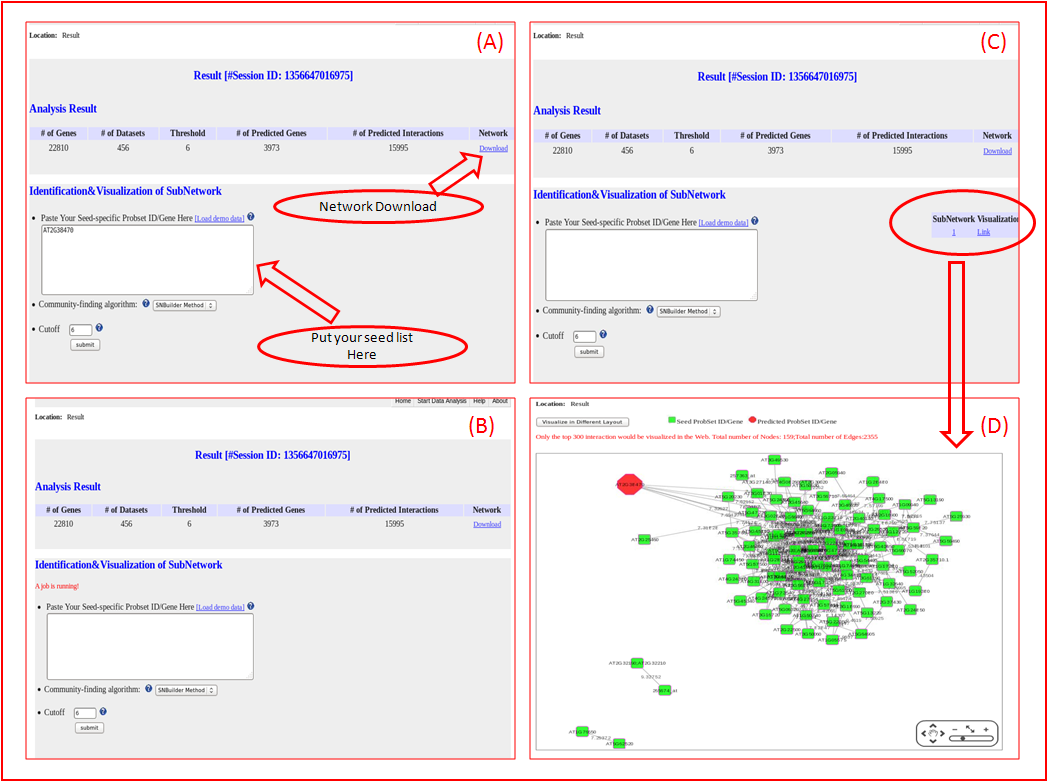
Our web server provided constructed network and subnetwork result for users donwloading. The network result is used to depict the genome-scale gene interactions; The subnetwork results is used to depict the identified subnetwork based on the constructed network and seeded Probset ID/Gene List. Meanwhile, our server provide function to visualize this subnetwork based on the Build-in Cytoscape Web Plugin.

7. Reference:

  • 1. Faith, J.J., Hayete, B., Thaden, J.T., Mogno, I., Wierzbowski, J., Cottarel, G., Kasif, S., Collins, J.J. and Gardner, T.S. (2007) Large-scale mapping and validation of Escherichia coli transcriptional regulation from a compendium of expression profiles. PLoS Biol, 5, e8.
  • 2. Kumari, S., Nie, J., Chen, H.S., Ma, H., Stewart, R., Li, X., Lu, M.Z., Taylor, W.M. and Wei, H. (2012) Evaluation of gene association methods for coexpression network construction and biological knowledge discovery. PLoS One, 7, e50411.
  • 3. Reshef, D.N., Reshef, Y.A., Finucane, H.K., Grossman, S.R., McVean, G., Turnbaugh, P.J., Lander, E.S., Mitzenmacher, M. and Sabeti, P.C. (2011) Detecting novel associations in large data sets. Science, 334, 1518-1524.
  • 4. Aluru, M., Zola, J., Nettleton, D. and Aluru, S. (2012) Reverse engineering and analysis of large genome-scale gene networks. Nucleic Acids Res.
  • 5. Hu, X. and Wu, F.X. (2007) Mining and state-space modeling and verification of sub-networks from large-scale biomolecular networks. BMC Bioinformatics, 8, 324.
  • 6. Kohl, M., Wiese, S. and Warscheid, B. (2011) Cytoscape: software for visualization and analysis of biological networks. Methods Mol Biol, 696, 291-303.
  • 7. Parkinson, H., Kapushesky, M., Shojatalab, M., Abeygunawardena, N., Coulson, R., Farne, A., Holloway, E., Kolesnykov, N., Lilja, P., Lukk, M. et al. (2007) ArrayExpress--a public database of microarray experiments and gene expression profiles. Nucleic Acids Res, 35, D747-750.
  • 8. Qiu, J.L., Fiil, B.K., Petersen, K., Nielsen, H.B., Botanga, C.J., Thorgrimsen, S., Palma, K., Suarez-Rodriguez, M.C., Sandbech-Clausen, S., Lichota, J. et al. (2008) Arabidopsis MAP kinase 4 regulates gene expression through transcription factor release in the nucleus. EMBO J, 27, 2214-2221.
  • 9. Birkenbihl, R.P., Diezel, C. and Somssich, I.E. (2012) Arabidopsis WRKY33 is a key transcriptional regulator of hormonal and metabolic responses toward Botrytis cinerea infection. Plant Physiol, 159, 266-285.

8. Funding:

  • This work was supported by National Science Foundation (Grant ABI-0960897) and the Samuel Roberts Noble Foundation.

9. Contact:

  • To contact us, please write to: bioinfo AT noble DOT org


  © 2011 by The Samuel Roberts Noble Foundation, Inc. Site by Zhao Lab