- How to search for a gene of interest, transcript or protein?
- How to search for gene family by its functional keyword?
- How to find gene families in a group of species of interest?
- How to generate a phylogenetic tree for a specific gene family?
- How to generate gene expression profiles for gene(s) of interest?
- How to find gene(s) with high expression in roots/nodules, but low expression in leaves?
- How to perform differential expression analysis?
- How to perform co-expression analysis for a gene of interest?
- How to perform co-expression analysis for a group of genes (modules)?
- How to quickly check expression profile for my gene of interest?
- How to cut a segment of a sequence from a specific chromosome based on coordinates?
- How to visualize gene models?
How to search for a gene of interest, transcript or protein?
LegumeIP V3 allows users to search for any genomic feature (gene, transcript, CDS, protein, promoter, etc.) by functional keywords, annotated ontology terms, coordinates or expression patterns.
To perform a search (by keywords, ontology terms or coordinates), first, select an organism and the genome annotation version on the Home Page (Figure 1). Then,
select Gene on top navbar, in Search gene page, and include relevant keywords describing gene functions, related ontology term ID
or coodinates (Figure 2), and select the genomic feature type (feature default is gene), then click Search to see the list of features in the returned page (Figure 3).

Figure 1. Select organism and genome annotation version.

Figure 2. Select gene and type keywords and/or coordinates to search for genomic features.

Figure 3. Browse returned list and further send your selection for downstream analysis, such as KEGG pathway analysis.
How to search for gene family by its functional keyword?
In LegumeIP V3, genes are classified by ontology terms. We recommend PANTHER term as default, other ontology terms, such as KO and GO are also available to classify genes, though.
For example:
First select Family from top navbar menu. In the Search gene family page define:
-
Select PANTHER in
Family type(default option), -
Define Keyword(s). For example
Auxin, if users are interest in auxin related gene family. Or, users can simply input PANTHER term name and chooseKeywordsareFamily names. It is worth to mention that the PANTHER families have been mapped to Gene Ontology, thus, it is possible to input GO terms or associated descriptional keywords to search the corresponding PANTHER terms. -
Select genome annotation version in the
Search by number of family memberssection, only checked genome annotation version will be searched and displayed in the result page. Please note, if an organism include multiple genome annotation versions, the latest one will be considered as default to be displayed while other (previous) versions can also be included by manually choosing it. In the example below (Figure 4), we selected only five species to search and display.

Figure 4. Gene family search.
After clicking on Search, users will find a table where which row denotes a PANTHER gene family and each
column represents a genome annotation release for a specific organism (Figure 5).
The value of each cell in the returned table is the number of genes for each organism selected and gene family. Users can further click on family name to see the list of genes and
detailed annotation information of a particular gene family, including alignment and pylogenic tree.
The table content is downloadable by clicking on download icon on top of the table.

Figure 5. List of gene families after search using Auxin keyword, five selected species and PANTHER.
How to find gene families in a group of species of interest?
For example, if you would like to find gene families only in legume species, but there are legume and non-legume species available in the LegumeIP V3.
In Family page, on Search by number of family members section, define gene number equal to zero for all non-legume species
and greater than zero for all legume species (Figure 6).
After clicking on Search, users will find a list of gene families that only have genes in legumes.

Figure 6. Search gene members in legumes.
How to generate a phylogenetic tree for a specific gene family?
After you search for a particular gene family or keyword (see details on How to search for gene family by its functional keyword?) on Family page, users will find a table
with gene members on different species selected (Figure 5), then just click on a particular gene family of interest (for example, Auxin Conjugate Hydrolase). In the new page users
will find more details for this particular family, including alignment information and phylotree (Figure 7).

Figure 7. PANTHER family page.
To generate a phylogenetic tree for this specific gene family, just click on Phylotree NeighborJoining (Figure 8), and users can download the respective newick file or PhyloXML file.
In this phylogenetic tree, users also can click on a particular Node to find more info, such as Bootstrap confidence and Consistency scores.

Figure 8. Phylogenetic tree example.
How to generate gene expression profiles for gene(s) of interest?
LegumeIP V3 allows users to perform different analyses, including expression profile of a gene or a group of genes of interest.
First select one species of interest on Home page, then Expression from top navbar menu, and Expression Profile.
Users have 2 options: (1) select relevant experiments from the ones available for each species, or (2) select a pre-selected condition, for example, Drought (Figure 9).

Figure 9. Gene expression profiles steps.
If you select a pre-selected condition, such as Drought (Figure 9), then in the next page you can define a gene or genes of interest.
You can select Load Demo Data to include a group of defined genes (Figure 10). Then select the type of output - Barchart or Linechart, and submit.
Users also can include Hide error bar.

Figure 10. Gene expression profiles steps.
As output (Figure 11), users will find a Barchart (or Linechart) for the different conditions and gene(s) showing normalized RPKM values. And also, two tables, one with with the expression values for each gene and condition, and another table with condition details.

Figure 11. Gene expression profile result.
Also, there are additional functions that users can utilize. Users can download expression information by clicking on Download tab (Figure 12),
and perform PCA analysis of sample(s)/replicate(s) (Figure 13).

Figure 12. Download gene expression information.

Figure 13. Sample/replicate PCA analysis.
How to find gene(s) with high expression in roots/nodules, but low expression in leaves?
Users can select a particular gene expression pattern, for example, high expression in roots/nodules, and low expression in leaves.
First select one species of interest on Home page, then Expression from top navbar menu, and Expression Profile.
Then, select experiment of interest or a pre-selected condition.
Click on Search gene tab, and select Find genes with your expression pattern of interest option. For each condition (row), users can define
the expression patterns - low or high (Figure 14).

Figure 14. Gene expression pattern function.
How to perform differential expression analysis?
First select one species of interest on Home page, then Expression from top navbar menu, and Differential Expression.
Select experiment, and then, conditions (numerator and denominator). Then, users need to set options, such as P-value cutoff, and edit condition names (Figure 15).
Users can also exclude a particular replicate if needed.

Figure 15. Differential expression example.
In the result page, there are several options that users can utilize (Figure 16).
Users can filter genes by p-value or log fold-change, and define a keyword.
Differential expression results can be directly visualized by clicking on Draw chart, or users can further analyse DE genes with Gene Ontology enrichment analysis,
KEGG pathway analysis, and also, covert genes to other genome.
All DE results can be downloaded in the same page.

Figure 16. Differential expression result page.
How to perform co-expression analysis for a gene of interest?
First, select one species of interest on Home page, then Expression from top navbar menu, and Co-expression.
Select experiment(s), and then, conditions of interest. Then, users need to set options (Figure 17), such as minimum value of effective expression (default value is 10),
ratio of effective samples (default value is 0.8), and top variance genes. Users can also define Beta values and select Large correlation coefficient matrix (but if selected the
process time will increase significantly). Users can also edit condition names and exclude a particular replicate if needed.
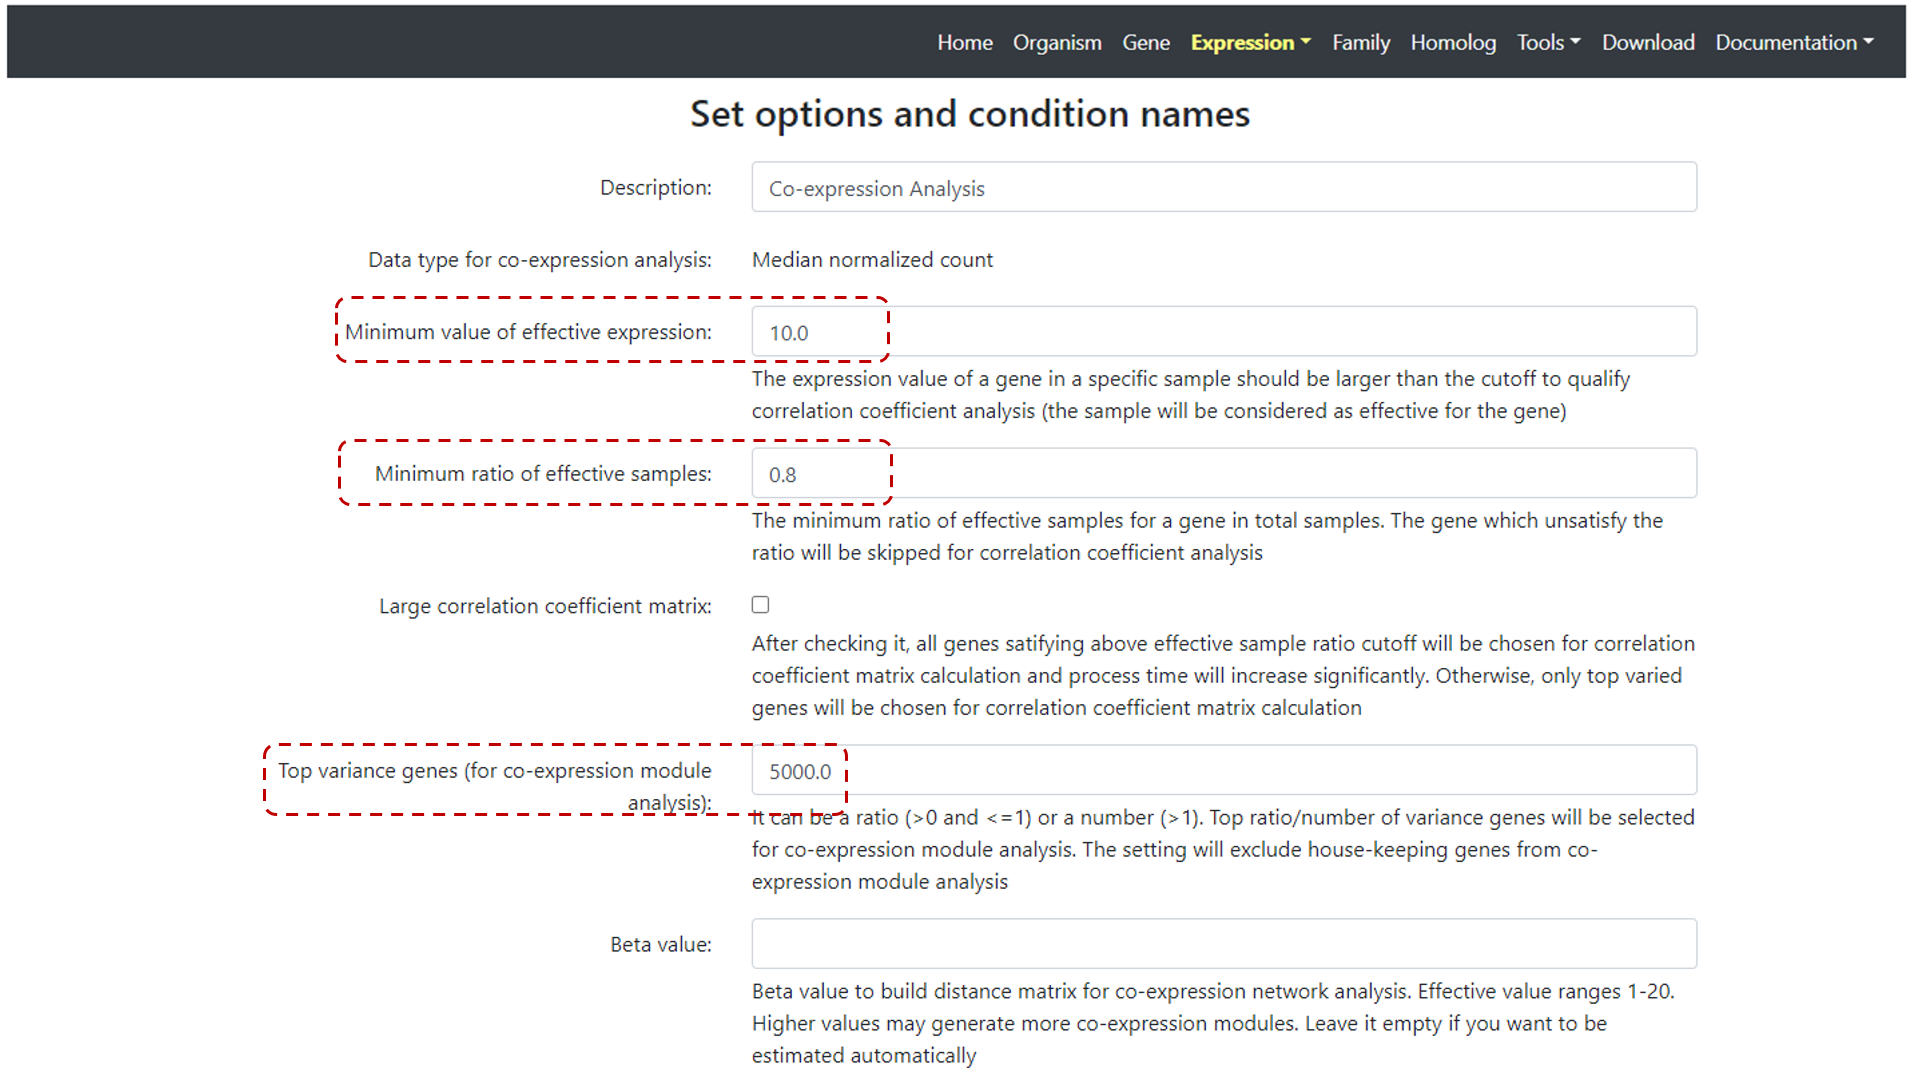
Figure 17. Co-expression set up page.
Next step is to selet a gene of interest. You can type a keyword or gene ID (Figure 18) on Search co-expressed gene/transcript for, for example AT1G04550 gene.
And also, select the Minimum of abs (correlation coefficients) value. Default value is 0.8. Then click on Search.
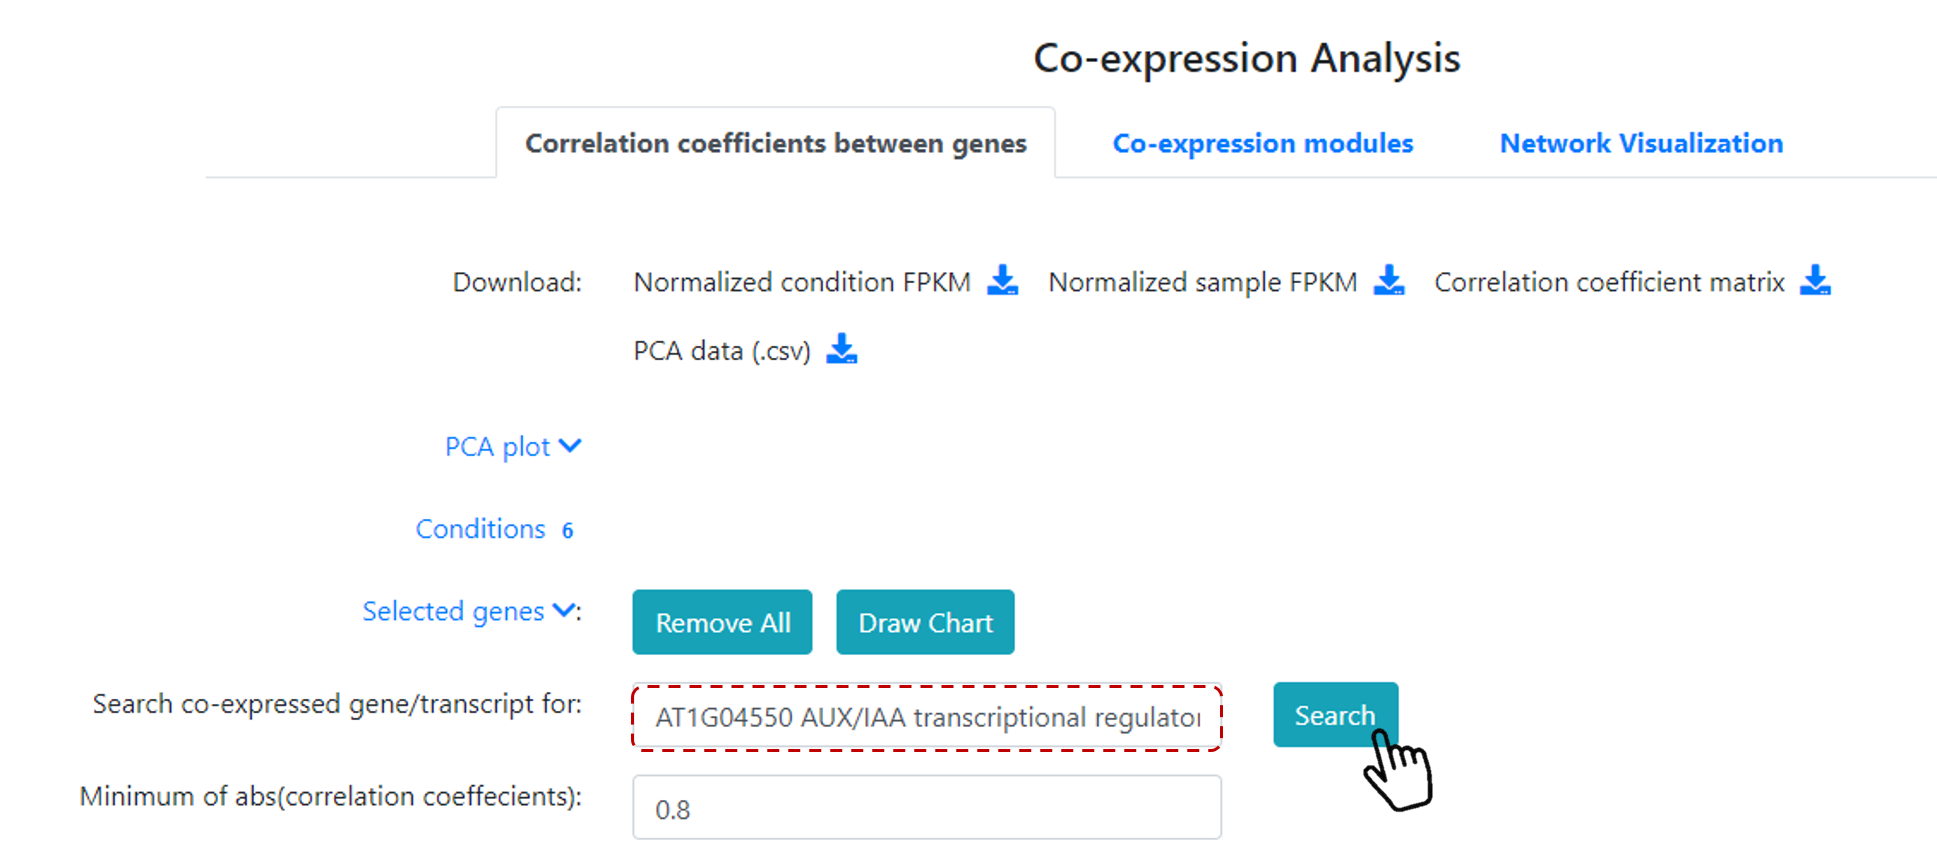
Figure 18. Co-expression analysis for a gene of interest.
A list of co-expressed genes will be available (Figure 19), and additional analyses can be done, such as Gene Ontology enrichment analysis, KEGG pathway analysis, and also users can covert to other genomes. Then, users can select a group of co-expressed genes (or all co-expressed genes) to generate a chart.
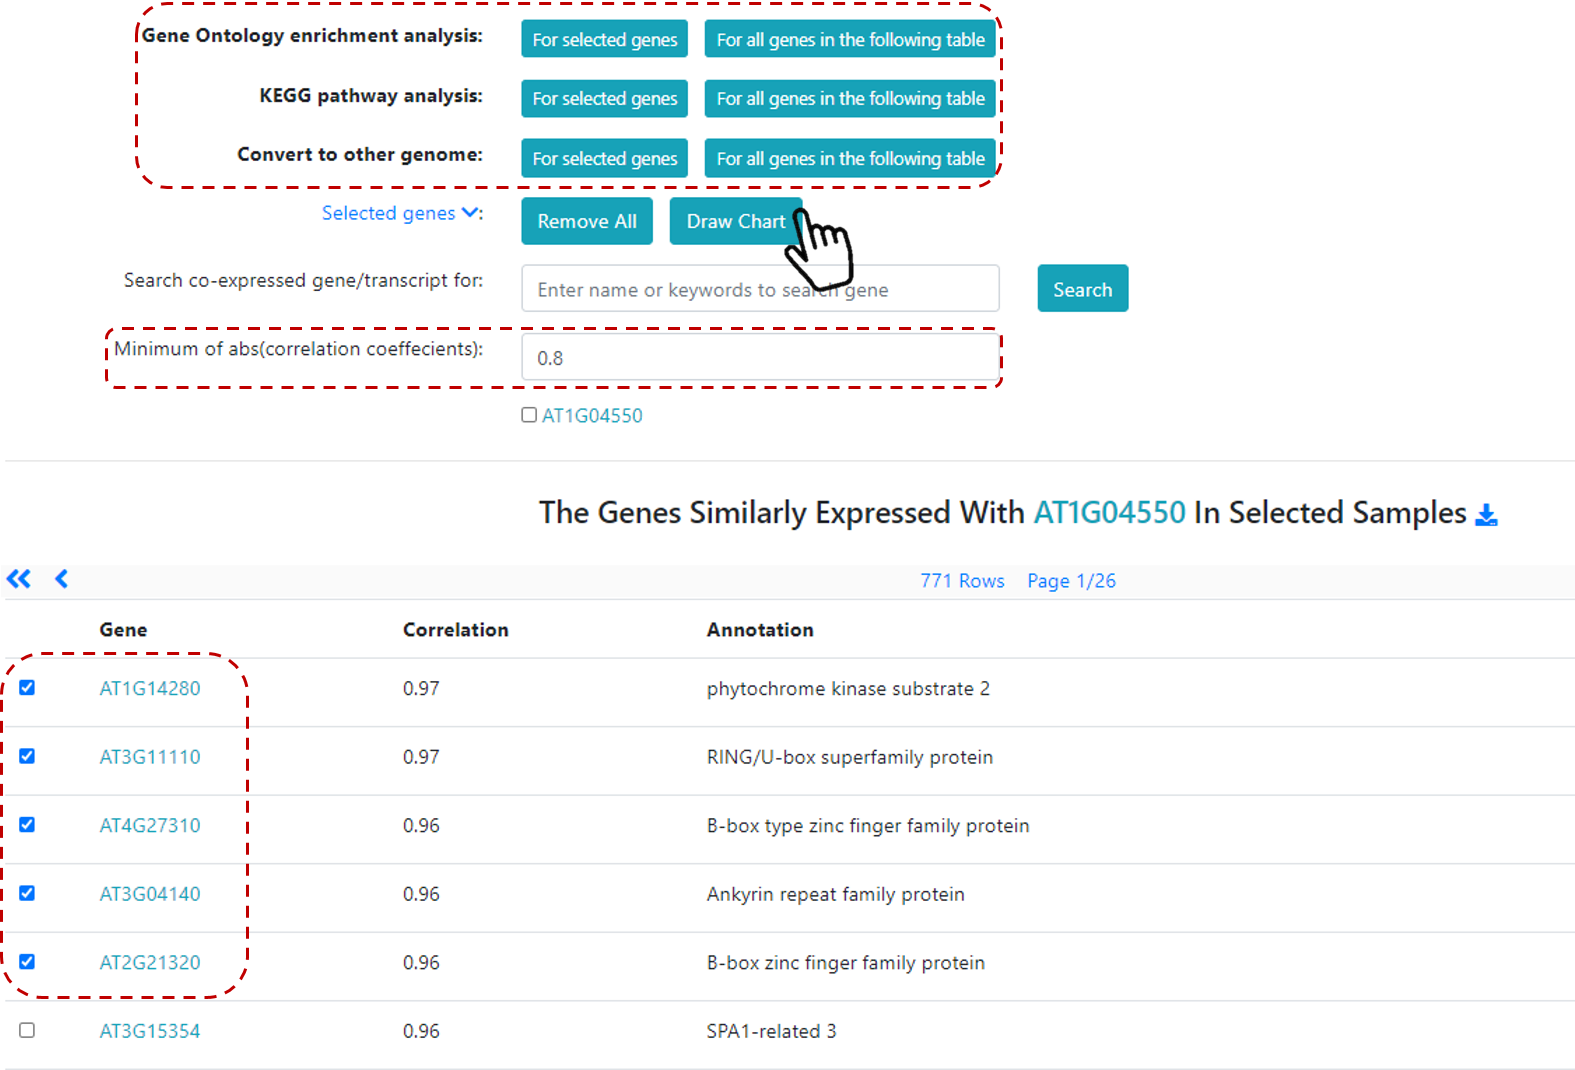
Figure 19. Co-expression analysis for a gene of interest.
How to perform co-expression analysis for a group of genes (modules)?
First, select one species of interest on Home page, then Expression from top navbar menu, and Co-expression.
Select experiment(s), and then, conditions of interest. Then, users need to set options (Figure 17), such as minimum value of effective expression,
ratio of effective samples, and top variance genes. Users can also define Beta values and select Large correlation coefficient matrix (but if selected the
process time will increase significantly). Users can also edit condition names and exclude a particular replicate if needed.
Next step, instead of select one gene of interest, users can click on Co-expression Modules, and a table with Co-expression Modules over selected samples will be available, including
Module IDs, number of genes, Enriched GO terms and Enriched KEGG pathways (Figure 20).
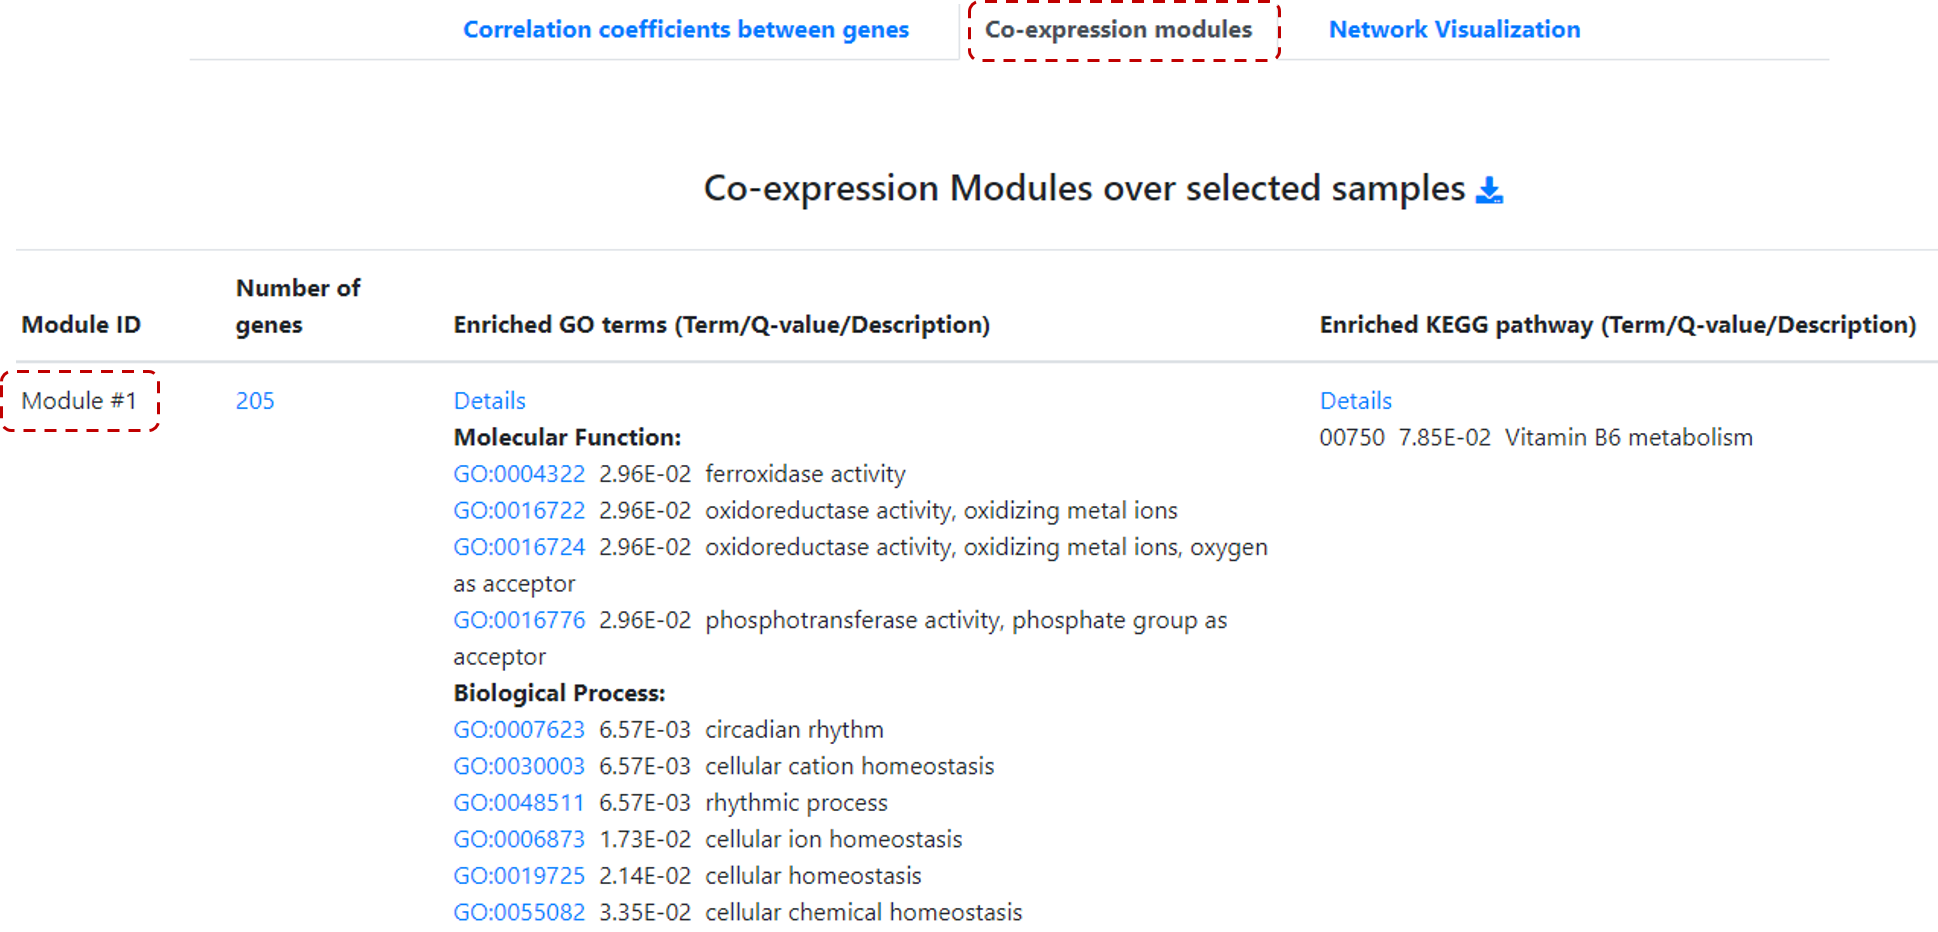
Figure 20. Co-expression analysis for a group of genes.
Users can visualize these co-expression modules by clicking on Network visualization. Then, define the number of co-expressed modules that you want to visualize,
for example 2 modules. Users can filter networks by correlation coeffecients values (default value is 0.9).
And, users can filter networks by keywords and gene IDs, and then, just click on Display Network Graph to generate graphs.
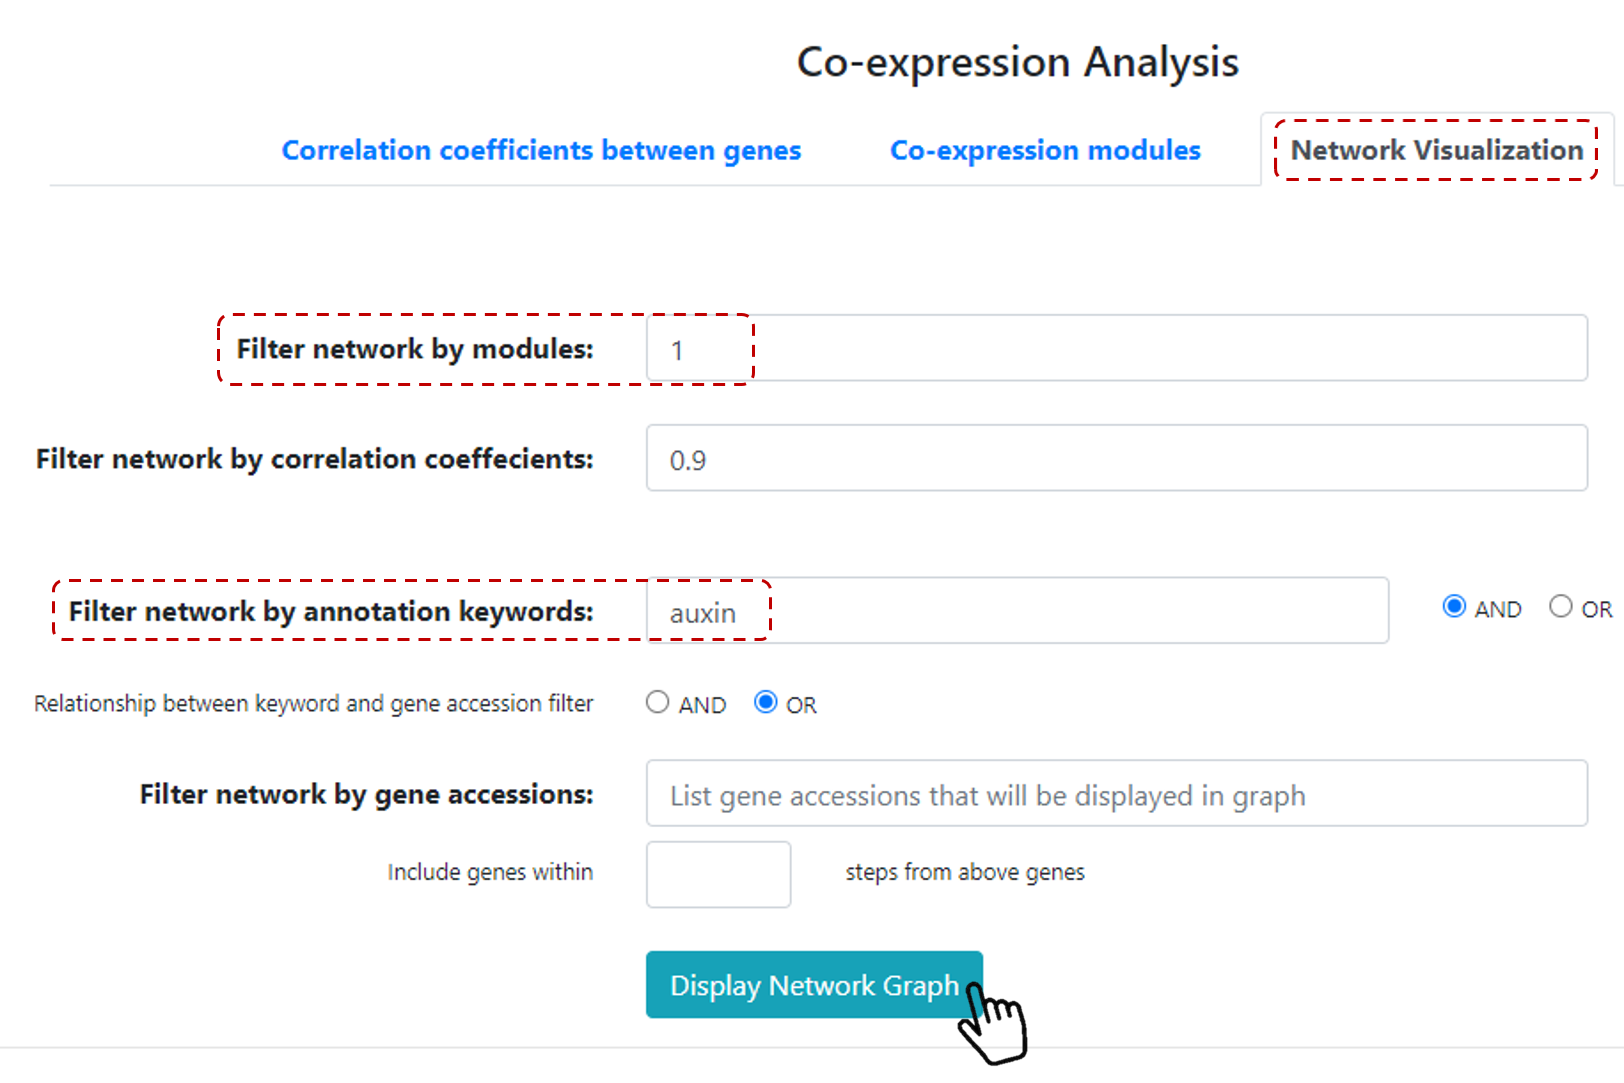
Figure 21. Co-expression module network.
How to quickly check expression profile for my gene of interest?
You can select one of our pre-selected conditions. Just select one species of interest on Home page, then on the rigth panel under Expression Profile, you can see pre-selected conditions
for this particular species (Figure 22). Click on Display or Expression pattern options in the condition of interest.
Display results in the expression profile for the defined condition, or define a specific expression pattern on Expression pattern.
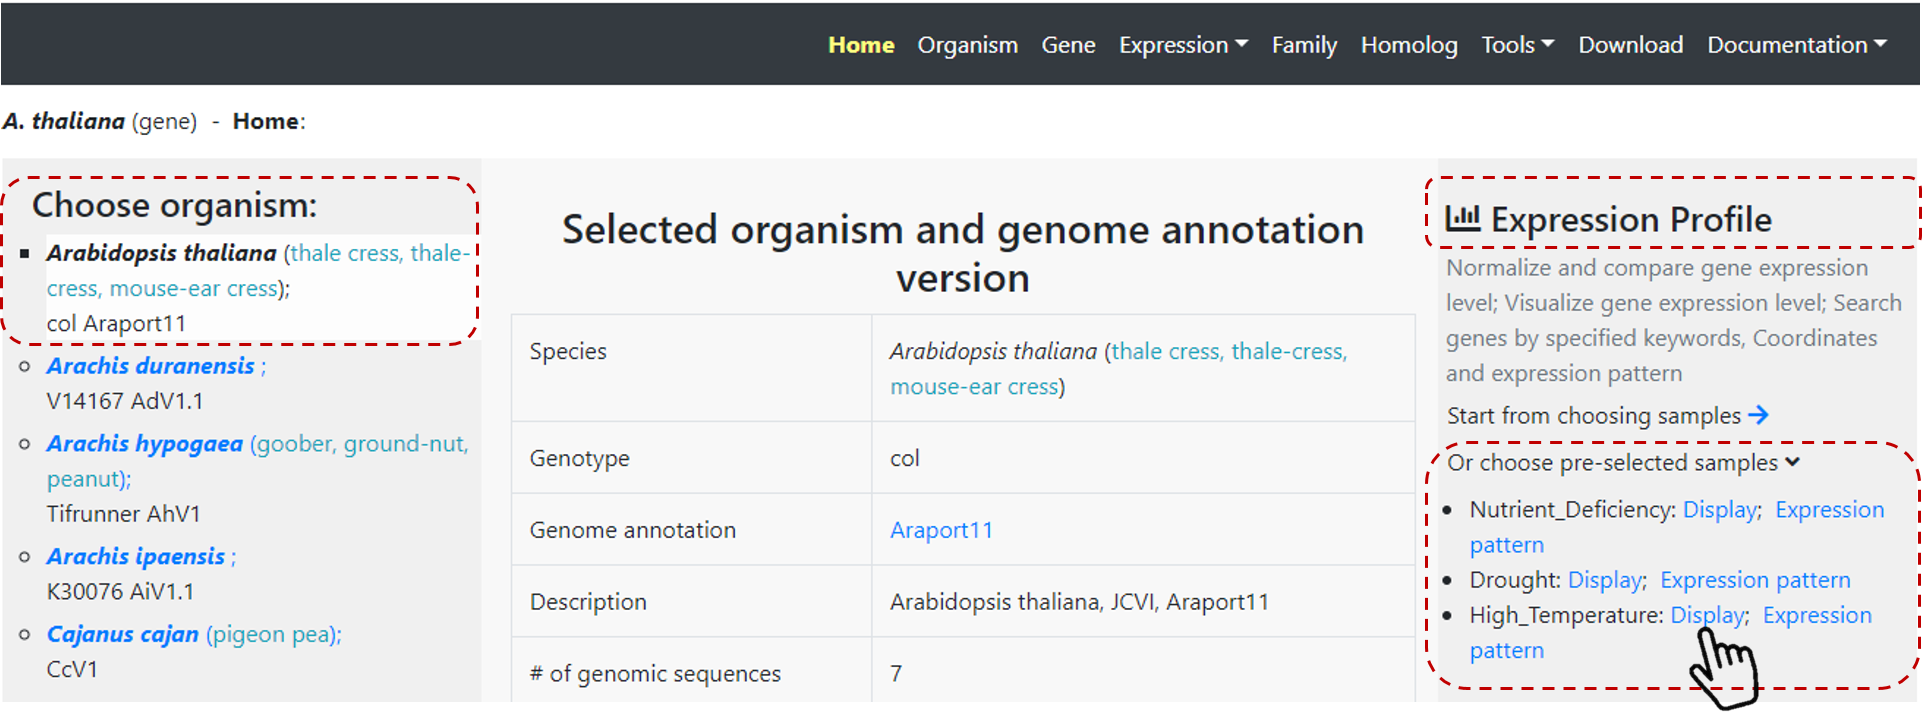
Figure 22. Expression profile from pre-selected conditions.
How to cut a segment of a sequence from a specific chromosome based on coordinates?
First, select one species of interest on Home page, then select Tools on the top navbar menu, and Sequence Cutter.
Then, define your regions to be cut with chromosome, coordinates, and strand. You can also upload a file with your regions.
Select the database to cut (Chromosome, gene, CDS, Transcript or Protein), and click on Submit (Figure 23).
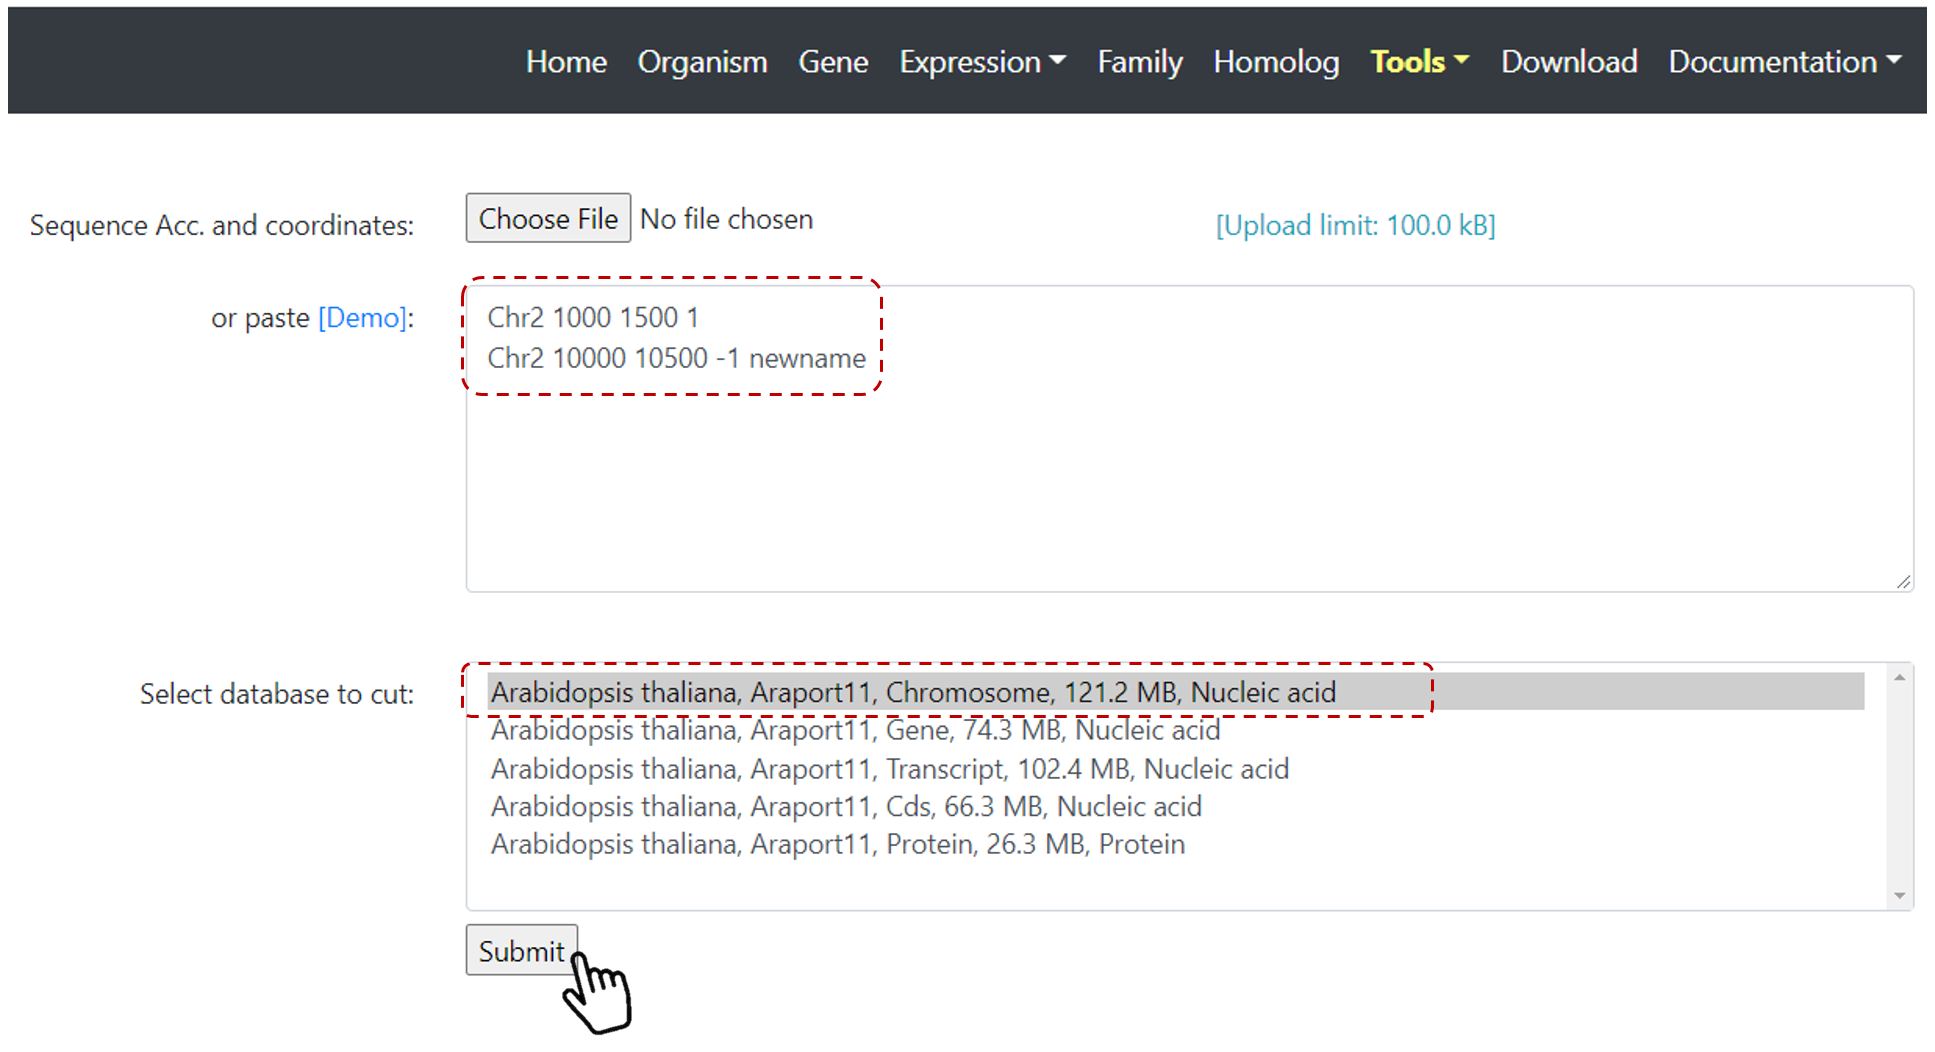
Figure 23. Sequence Cutter set up page.
How to visualize gene models?
First, select one species of interest on Home page, then select Gene on the top navbar menu.
Users can select gene(s) of interest by keyword, gene ID or coordinates. For example, search Arabidopsis gene AT5G65720 (Figure 24).
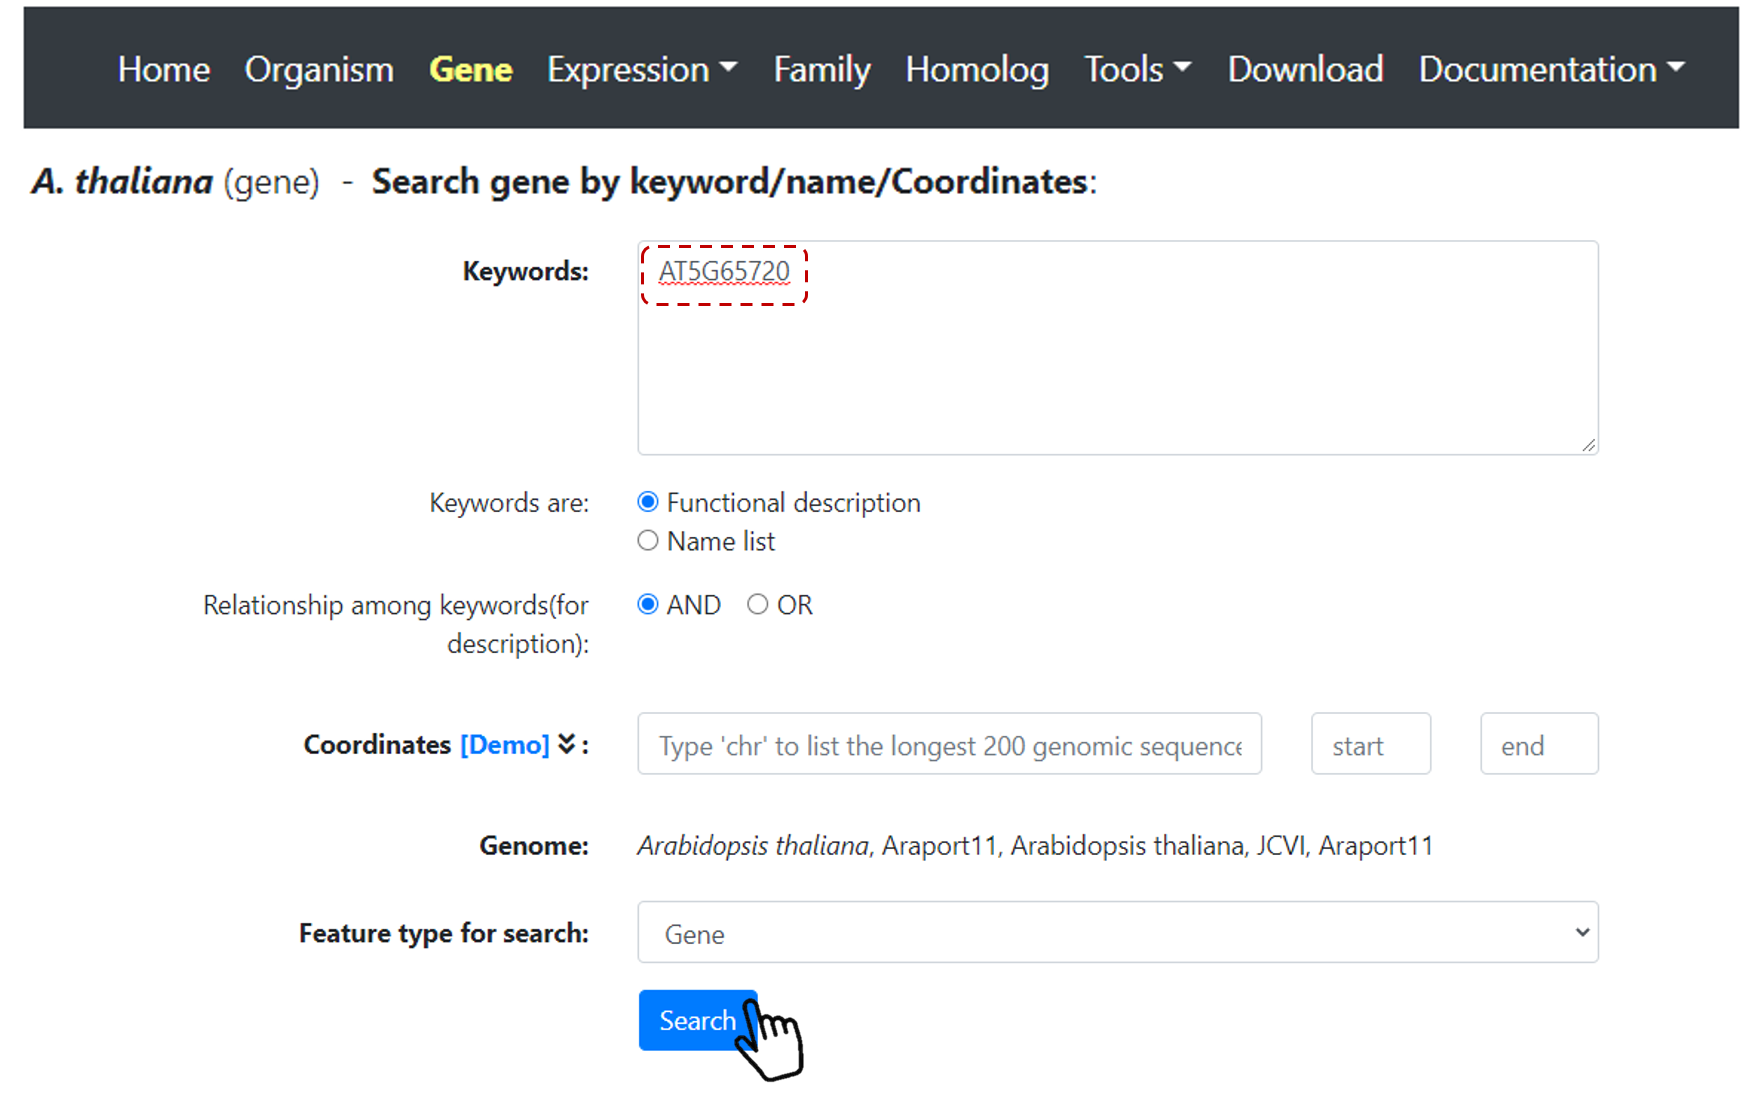
Figure 24. Gene search.
Then, click on the gene ID link (Figure 25).

Figure 25. Gene search link.
Users can access Gene Card page for this specific gene searched (Figure 26). And users can find more information for a particular gene in this page, including coordinates, annotation, sequence, and also, a Generic Genome Browser (GBrowse) is available. Users can visualize a gene by using Gbrowse. GBrowse is an interactive page for manipulating and displaying annotations on genomes (Figure 26).
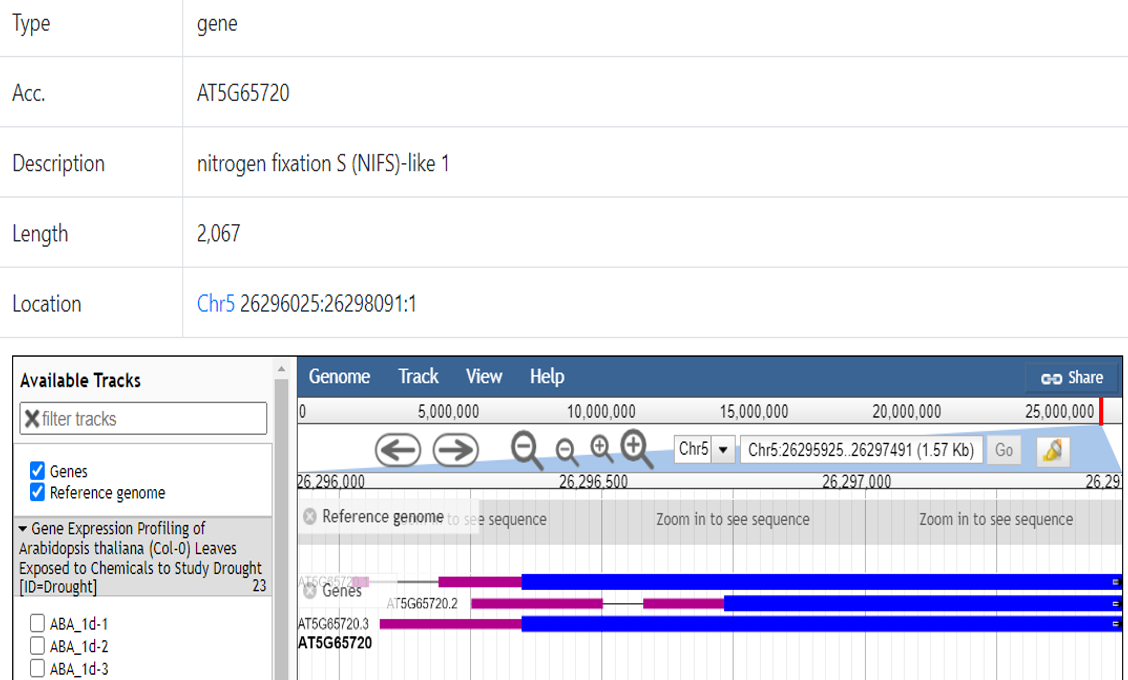
Figure 26. Gene card page.